
Instagram Story Insights Explained and How to Use Them
Published on
Tags:
You publish a Story, watch the first frame collect views, and assume the job is done. Then the Story expires, the native numbers disappear from the app, and your API export doesn't match what Instagram showed in the dashboard. At 2am, you're left debugging timestamps, metric names, and an endpoint that seems to have a different opinion about reality.
Instagram Story Insights aren't broken, but they're easy to misuse. Stories are ephemeral, their native history is short, and each metric describes a different point in the viewer journey. Treating every number as a popularity score produces reports that look tidy and explain very little.
Table of Contents
Why Instagram Story Insights Feel Broken at First
A Story can look healthy in the app at noon and become difficult to audit after it expires. Instagram Stories launched in August 2016 as full-screen, ephemeral content, and a Story normally stops being live after 24 hours. Native Story analytics remain available in the app for only 14 days, according to the documented platform behavior summarized by Instagram Stories launch history. Without an export or scheduled capture, performance evidence can disappear before the next reporting cycle.
The next failure appears when surfaces are compared. The app may show one value, an API response another, and a webhook payload something else. Meta's official documentation warns that the same Insights endpoint can return different results in API calls, webhook notifications, and user interfaces. A mismatch can reflect timing, calculation state, or presentation rather than a faulty parser or stale token.
Practical rule: Treat Story data as a time-sensitive event stream, not as a permanent database table.
Capture the Story identifier, publication time, expiry time, metric values, and retrieval time while the record is available. The retrieval timestamp matters because it lets you distinguish a late-arriving value from a genuinely changed result. For analysis, connect metrics to the viewer path: unique reach shows distribution, sequence retention shows whether viewers stayed, navigation shows where they moved, and interactions show whether attention became an action. Raw views cannot answer all four questions.
Why ephemeral content needs different logic
A feed post supports longer comparisons because the content remains available and can keep accumulating interactions. A Story compresses measurement into a short window. Its opening frame may attract distribution, while later frames expose skips, exits, returns, replies, sticker taps, and other signs of retention or intent.
Review the metrics as a pair of decisions:
Did the Story reach the intended audience?
What did viewers do after arriving?
A high opening reach with rapid exits points to a retention problem, while sustained sequence viewing with replies or taps suggests stronger business relevance. That combination is more useful than ranking Stories by views alone.
Instagram provides native Insights for creator and business accounts. External reporting systems can preserve historical records beyond the native window. The Instagram Story analytics guidance separates reach, views, completion, replies, navigation, and interaction signals, a practical framework for joining app metrics with API timing and retention limits.
What Instagram Story Insights Actually Measure
Instagram Stories began as a format for content that disappears, but the measurement system grew beyond a single view count. Current Story Insights describe distribution, navigation, and interaction. Those categories matter because they map to different questions about the viewer journey.
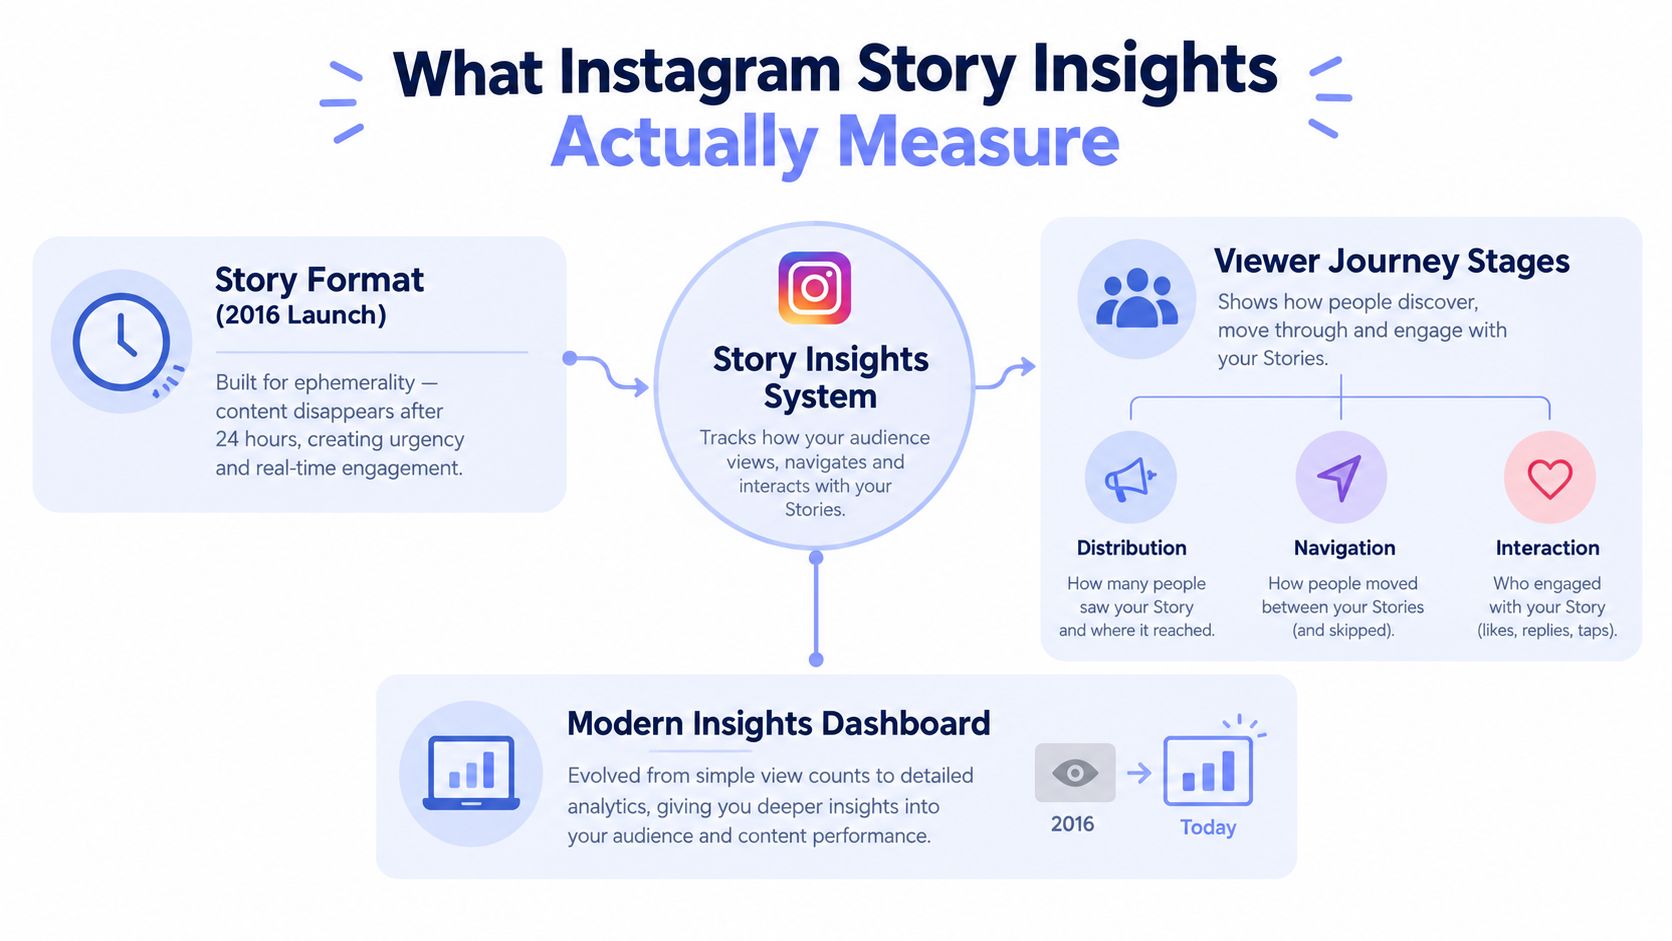 A diagram infographic explaining the components and evolution of Instagram story insights analytics for content creators.
Start with distribution
Reach counts unique accounts. Views, and older references to impressions, describe total consumption. The simplest analogy is a shop: reach is the number of unique visitors who entered, while views are the number of times the door opened. One person can account for multiple views through replaying or revisiting content.
Instagram also changed the reporting vocabulary by folding the older impressions metric into a unified views metric across posts, Reels, and Stories. That makes cross-format reporting simpler, but it also means older reports may use a different label for a closely related consumption concept. Don't compare labels without checking the reporting period and definition.
For a deeper explanation of how reach, views, navigation, and interactions fit together, grow with Sup Growth insights provides a useful companion reference. The important operational point is that a view doesn't tell you whether the viewer was new, whether they replayed a frame, or whether they reached the end.
Follow the viewer journey
Navigation signals show movement through the sequence:
Taps forward indicate that a viewer advanced to the next frame.
Taps back indicate movement to an earlier frame, which can reflect interest, clarification, or a missed detail.
Exits indicate that the viewer left the Story experience.
Completion rate estimates sequence retention by dividing views on the last frame by views on the first frame, then expressing the result as a percentage.
Interaction signals add intent. Replies start a conversation, sticker taps show engagement with interactive elements, and link clicks connect the Story to an external destination. You can also review the broader implications of Instagram impressions and views, especially when older exports use impressions while newer dashboards use views.
The dashboard isn't merely reporting volume. It gives you enough signals to separate audience expansion, repeat consumption, retention, and action. That separation is what turns Instagram Story Insights into a decision system instead of a scoreboard.
Every Story Metric Explained and How It Is Calculated
A metric dictionary is useful only if it changes what you do next. Read Story signals in the order a viewer experiences them, from arrival to movement to action.
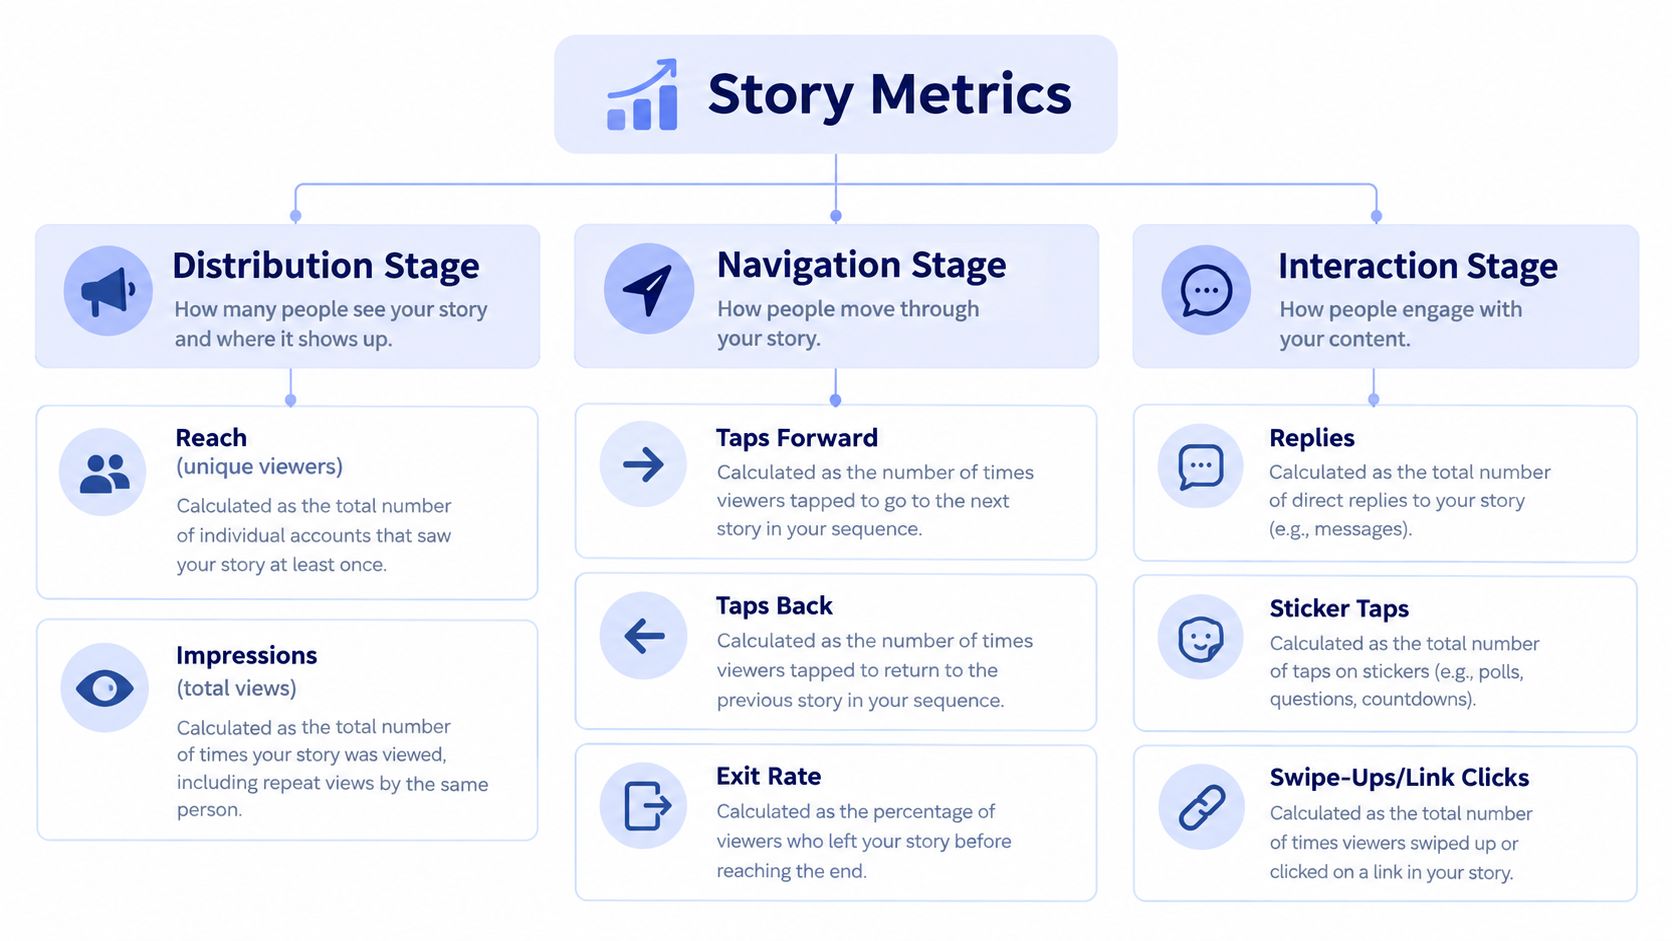 A comprehensive infographic explaining various Instagram story metrics categorized into distribution, navigation, and interaction stages.
Distribution signals
Reach is the count of unique accounts exposed to the Story. Views count total plays, so repeat viewing can increase views without expanding the audience. Older Insights and API documentation may use impressions for total views, including repeat views. The distinction is operationally important: a growing reach suggests broader distribution, while a growing views-to-reach relationship suggests repeated consumption.
Navigation signals
Taps forward measure advancement to the next frame. A high value can mean the frame is clear and the viewer wants to move through the sequence, but it can also indicate that the frame is too slow, obvious, or poorly paced.
Taps back measure movement to a previous frame. They often deserve more attention than forward taps because they can indicate that a detail was worth revisiting. Interpret them with context, especially when a frame contains instructions, a product detail, or dense information.
Exits measure departures from the Story. They mark a retention failure at a particular point, but they don't explain the cause by themselves. The cause might be weak creative, excessive length, an interruption, or a viewer reaching the end of the available content.
Completion rate uses the first and last segments of a sequence. The documented calculation is:
completion rate = impressions on the last segment ÷ impressions on the first segment × 100
For business profiles, the available reach and impressions window may be restricted to the first 24 hours after publication, as described in Sprinklr's Story Insights documentation.
Interaction signals
Replies are direct responses. Sticker taps measure interaction with stickers such as questions, polls, or other interactive controls. Link clicks measure visits initiated through the Story's link element. These signals are closer to intent than passive consumption, but each still needs to be judged against the Story's objective.
Metric | What It Counts | What High Value Suggests |
Taps forward | Movement to the next frame | Fast progression, curiosity, or weak pacing |
Taps back | Movement to a prior frame | Rewatching, clarification, or missed information |
Exits | Departures from the Story | Friction, weak retention, or natural stopping point |
The most useful comparison is rarely one metric alone. Compare reach with views, first-frame views with last-frame views, and navigation with interactions. A high views-to-reach relationship indicates repeat consumption, not necessarily broader distribution. A high exit count at one frame identifies where to investigate, not what conclusion to publish.
Where to Find Story Insights in App and API
The native app is convenient for inspection. It isn't a reliable archival system. For creator and business accounts, open the profile, enter the Insights area, go to shared content or Stories, and select the Story for detailed performance data. For a live Story, tapping the posted Story and opening its detailed statistics gives you the fastest route to current signals.
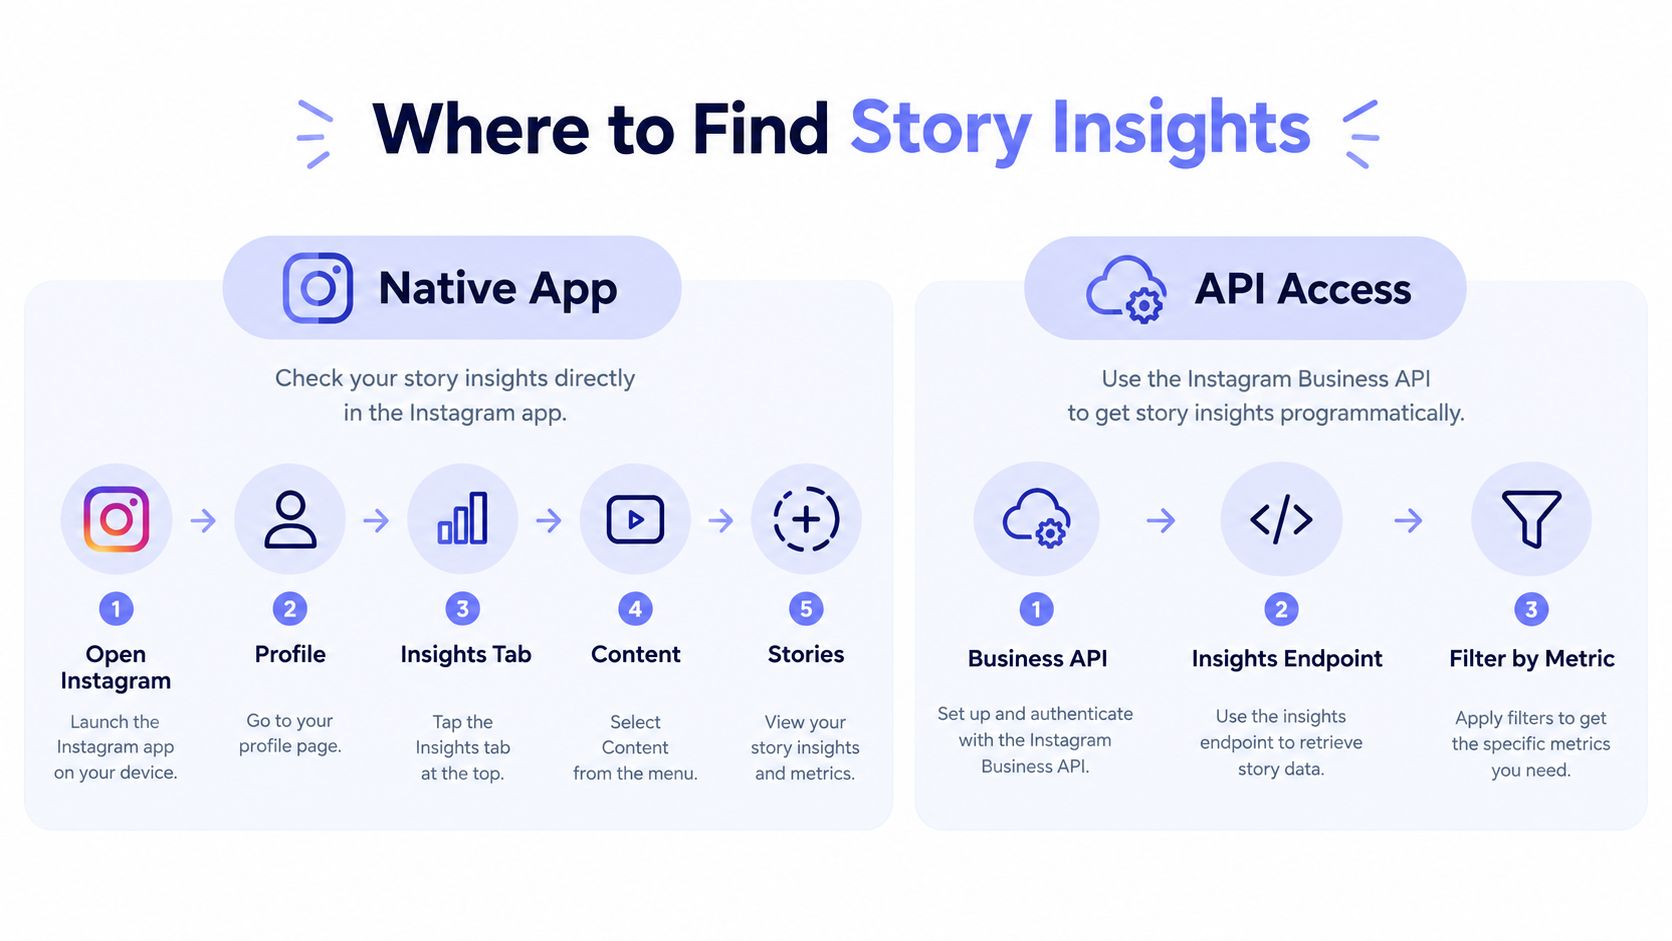 A diagram illustrating two methods to access Instagram story insights: via the mobile application or programmatic API.
The API path has a clock attached
Meta's official Instagram Media Insights documentation states that Story Insights must be fetched before the Story expires. If the Story is later added to a Highlight, data may remain available after expiration, but that shouldn't be your primary collection strategy. A Highlight changes the content's availability context, not the need for careful ingestion.
The API exposes concrete Story metrics such as exits, impressions, reach, replies, taps_forward, and taps_back, rather than one vague engagement field. Your collector should store the raw response and the normalized interpretation, because metric names and presentation can differ across versions and surfaces.
Webhooks are not immediate exports
Meta's Instagram webhook documentation says that subscribing to story_insights triggers a notification after the Story expires, with the notification sent 1 hour after expiration. That event is useful for coordination, but it arrives after the content's active period. If your workflow waits for the webhook before attempting every fetch, you risk missing the collection window.
Use a defensive sequence:
Capture early: Fetch available metrics before expiration.
Record timestamps: Store publication, expiration, request, and response times.
Keep raw payloads: Preserve the original response for later debugging.
Reconcile surfaces: Don't overwrite values without recording their source.
Handle expiry explicitly: Mark unavailable data instead of retrying forever.
For teams building around the Instagram Business API, the hard part isn't displaying a chart. It's designing an ingestion process that understands expiration, delayed notifications, and surface-level discrepancies.
How to Read Contradictory Signals Without Guessing
Contradictory metrics usually become useful once you stop asking which number is correct and start asking what each number is measuring. A Story can reach more accounts while losing viewers earlier. It can produce more views without expanding reach. It can receive taps back and replies while showing a disappointing completion rate.
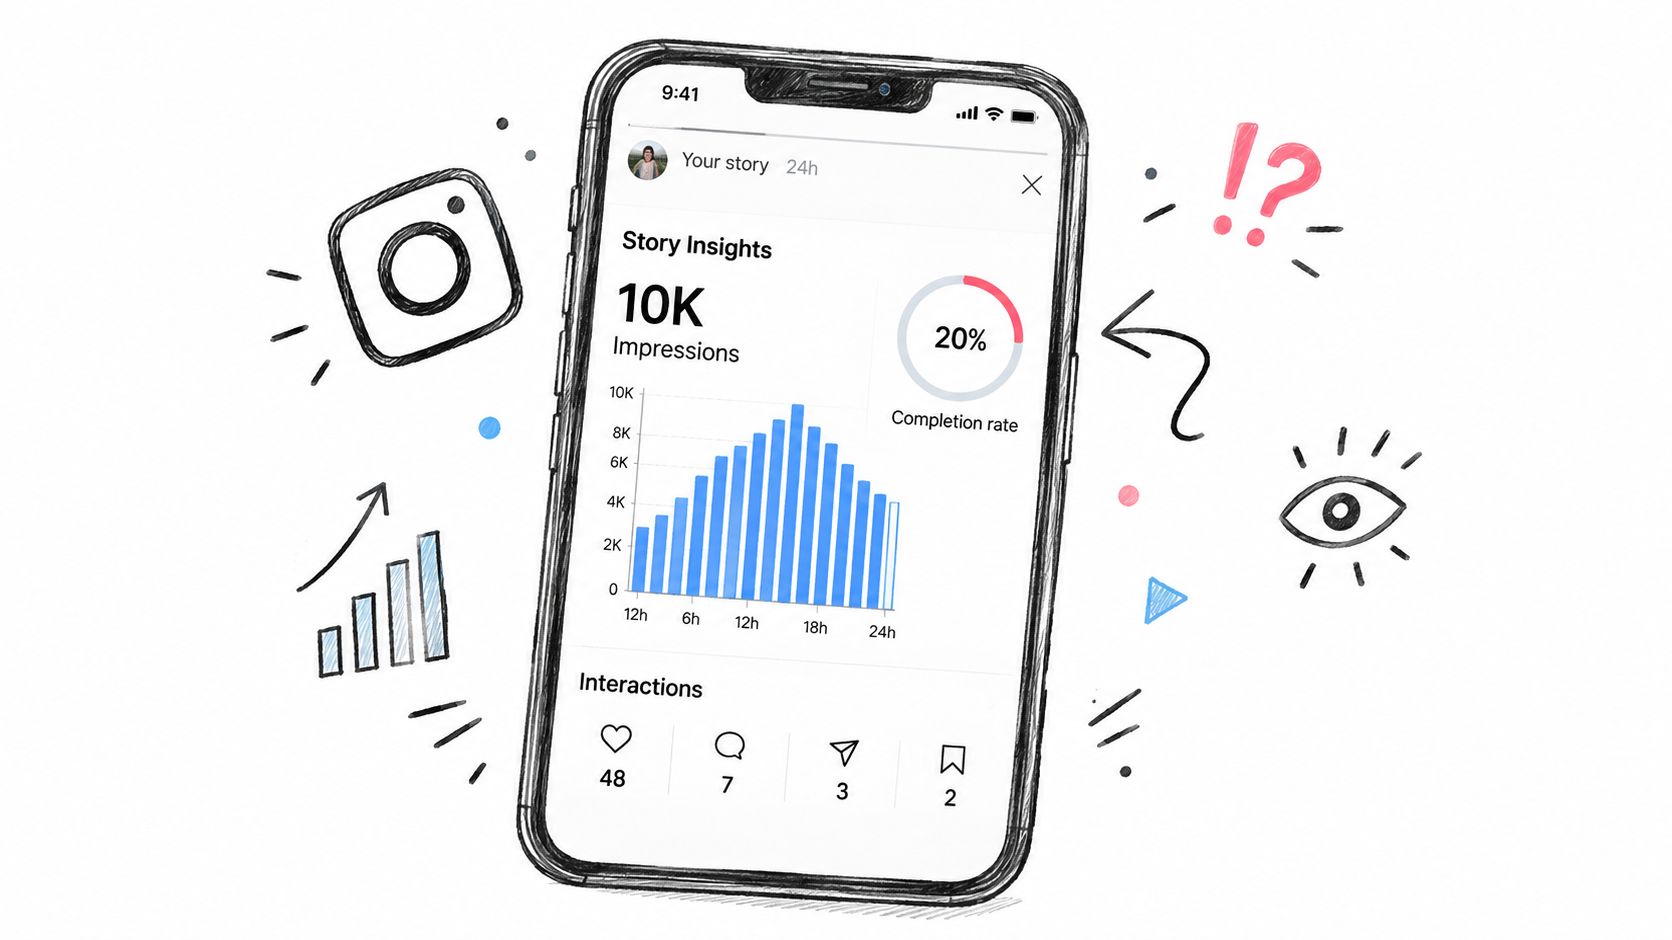 A smartphone screen showing Instagram story analytics featuring a graph of impressions and interaction counts.
Separate distribution from retention
Suppose reach rises and exits rise at the same time. The Story is finding more accounts, but the additional distribution isn't proving that viewers stayed. That combination points to a discovery or targeting success with a retention problem.
Now take the opposite pattern. Reach stays stable, while views increase and taps back appear frequently. That suggests repeated consumption by the existing audience. It may be valuable for explanatory content, but it doesn't prove that the Story expanded awareness.
Completion rate helps locate the loss across the sequence. Use the first-frame and last-frame values from the same reporting context. If first-frame views are large and last-frame views are much smaller, the sequence lost attention somewhere between entry and finish. Don't diagnose the exact frame from the aggregate rate alone. Use frame-level exits and forward taps to find the likely break.
A useful report doesn't say “performance was high.” It says which stage improved, which stage degraded, and what action follows.
Match the metric to the job
For awareness, prioritize reach and then inspect whether exits climbed alongside it. For retention, prioritize completion, forward taps, back taps, and exits by frame. For conversion, prioritize link clicks and replies, then connect those actions to the destination's own analytics.
High impressions with weak completion and interaction shouldn't receive an automatic success label. The Zemith data guide is a useful additional reference for thinking about data as a decision input rather than a collection of attractive totals.
The practical workflow is simple: define the objective before publishing, choose the primary signal, select a guardrail, and record the result. For a traffic Story, link clicks may be primary, while exits and completion act as guardrails. For a tutorial, completion and taps back may matter more than reach. This avoids optimizing a number that has no relationship to the outcome you need.
Turning Insights Into Better Stories and Benchmarks
A Story can reach many viewers and still lose them before the final frame. Start with the failure mode, then change the creative. Early forward taps usually point to a weak opening or unnecessary setup. Exits concentrated on a dense frame suggest that the message needs less information or another frame. Strong back taps and replies indicate useful subject matter, so improve the route to the next action instead of replacing the topic.
Interactive elements produce deliberate responses, which makes them more useful for diagnosing intent than passive views. A 2026 data roundup reports 2.4x higher recall for interactive Stories and a 73 percent completion rate for short Story-ad sequences. Treat these as directional benchmarks, not account-level promises. The figures appear in Digital Applied's Instagram statistics and trends roundup. Compare them with your own baseline, and keep the metric definition and reporting context beside the result.
Use benchmarks as diagnostic boundaries
The same benchmark discussion reports cross-industry Story engagement around 0.48 percent, tap-through near 4.7 percent, and swipe-up or link-click rate near 1.2 percent. Those values are modest, so small improvements can matter when publishing volume and measurement stay consistent.
A benchmark becomes useful only after three checks: does its definition match yours, is the denominator reach, views, or impressions, and does the content pursue the same objective? A reach benchmark cannot grade a conversion Story fairly.
Test the sequence, not just the asset
Change one lever per experiment:
Opening frame: State the problem or payoff quickly, then compare first-frame retention.
Sequence length: Remove redundant setup and inspect completion and exits.
Interaction design: Add a relevant sticker or question, then check sticker taps and replies.
Call to action: State the desired action clearly and measure link clicks.
Information density: Move detail to a later frame and compare back taps and completion.
Shorter sequences are not automatically better. A short Story may complete well without generating action. A longer sequence may earn back taps and replies because viewers find the detail useful. Use first-frame views, last-frame views, exits, and action metrics together. Native app totals help with immediate diagnosis, API values may arrive on a different schedule, and retention limits make the collection timestamp part of the benchmark. The Hooked Instagram Stories guide provides context on Story video length, while frame-level behavior should decide what remains.
Reporting Templates and Workflows That Survive the 14 Day Limit
A Story report can fail before anyone opens it. Native Instagram Story Insights support recent diagnosis, while the platform's 14 days retention window can remove the comparison data a month-end review depends on. Schedule collection early, then store the raw response outside Instagram. An external archive may retain Story performance for 12 months or more, as described in Socialinsider's Instagram Stories analytics guidance.
Archive the viewer journey, not only the final totals. For each Story or sequence, save the account, Story identifier, publication timestamp, expiration timestamp, frame order, reach, views or impressions, taps forward, taps back, exits, replies, sticker taps, link clicks, completion inputs, and collection timestamp. Store metric definitions beside each value. Analysts should be able to identify whether “views” came from the app, API, or a transformed report.
The collection timestamp belongs in every row. Native app totals can help diagnose performance immediately, while API values may arrive later. A retention metric without its retrieval time can produce a false trend.
A workable review template
A weekly review can remain compact:
Distribution: Reach, total views, and the relationship between them.
Retention: First-frame views, last-frame views, completion rate, and exit locations.
Navigation: Forward and back taps by frame.
Interaction: Replies, sticker taps, and link clicks.
Decision: One creative change for the next publishing cycle.
Use metric combinations to choose the next action. High reach with weak first-frame retention points to an opening problem. Strong completion with few link clicks points to a call-to-action or offer problem. Back taps and replies can justify retaining a longer sequence when viewers seek more detail. A single total cannot make those distinctions.
A monthly review should group Stories by objective, format, topic, and sequence structure. Compare recurring patterns instead of isolated winners, and record the test each pattern supports. This social media reporting workflow offers a useful operating model for turning platform data into recurring reports.
PostPulse can serve as a publishing and analytics layer in this workflow. Its documentation describes Instagram publishing and platform-native metrics for Stories and Reels. Its API, n8n and Make.com integrations, and MCP server can support automated collection across supported channels. Schedule collection before expiration, preserve raw responses, and show the source surface in every report.
Before signing off, verify that:
Collection is scheduled early: Do not rely only on post-expiration events.
Expiry is handled: Failed fetches appear as visible exceptions.
Definitions are versioned: Reports preserve each metric's interpretation.
History is externalized: Native Insights are not the sole archive.
Decisions are recorded: Each review produces a testable next step.
PostPulse provides one publishing and analytics surface for Instagram and other social channels, with REST API, n8n, Make.com, and MCP access. Visit PostPulse if your stack needs a shared place for token handling and Story reporting.
About the Author

Founder of PostPulse — a social media scheduling platform for creators and teams. Software engineer with a passion for building developer tools and simplifying complex API integrations across social media platforms.