Impressions on Instagram Explained for Developers
Published on
Tags:
You pull Instagram metrics for a dashboard, wire up the chart, and immediately think your code is wrong. Reach looks reasonable. Impressions look inflated. Sometimes wildly inflated. The post has fewer followers than the impression count, and now someone on your team is asking whether the API duplicated rows or whether your aggregation logic is broken.
Usually, it isn't a bug. It's a metric-definition problem.
Instagram makes this especially annoying because the UI, the API surface, and Meta's changing metric strategy don't always line up cleanly. If you're building reporting for clients, internal analytics, or a product feature, you need a developer-grade model of what impressions on Instagram mean, where they still exist, and when they should not be your primary benchmark.
Table of Contents
The Problem with Instagram Impressions
A common failure mode looks like this. You fetch account or media insights, join them into a reporting table, and someone notices that impressions are much higher than reach. The first instinct is to suspect duplicate events, pagination errors, or a mismatch between account-level and media-level metrics.
That suspicion is reasonable. A lot of analytics bugs do come from exactly that kind of plumbing mistake. But with impressions on Instagram, the weird-looking number is often the correct one.
The reason is simple: impressions don't represent unique people. They represent total times content was shown. If one account sees the same Reel in feed, then later stumbles across it again from profile, that can contribute more than once to impressions while reach stays tied to the unique account.
Why devs get tripped up
Developers usually expect one of two patterns:
Unique audience metric: one user, one count
Event metric: one delivery event, one count
Instagram mixes both ideas in the same reporting conversation. Reach is the unique audience view. Impressions are the repeated delivery view. If your dashboard doesn't label that distinction aggressively, users will misread it every time.
Practical rule: If a stakeholder asks "how many people saw this," they want reach. If they ask "how often was this shown," they want impressions.
The confusion gets worse when you're pulling multiple content types and trying to normalize them into one schema. Instagram's product has changed over time, and some organic surfaces now push you toward other metrics instead of impressions. If you don't account for that, your reporting layer can look inconsistent even when your code is doing exactly what the platform allows.
The dashboard problem is really a semantics problem
The metric's name sounds more authoritative than its actual scope. "Impressions" suggests a broad truth about audience visibility. However, in practice, it is narrower. It functions as an exposure counter. While useful, it is easy to misuse.
For a reporting product, the safest move is to treat impressions as a specialized metric with explicit caveats, not as the default top-line KPI.
What Are Instagram Impressions Really
At a technical level, impressions on Instagram are better understood as total display events than as audience size. A single account can generate multiple impressions if the content appears repeatedly across Instagram surfaces. That's why this metric behaves more like a request counter than a unique-user counter.
Think of impressions like total deliveries
If you want a clean mental model, think of it this way:
Reach is unique recipients.
Impressions are total deliveries.
Engagement is what recipients did after delivery.
That model holds up well when you're designing a data pipeline. You wouldn't compare API request count to unique API consumers and expect them to match. Same idea here.
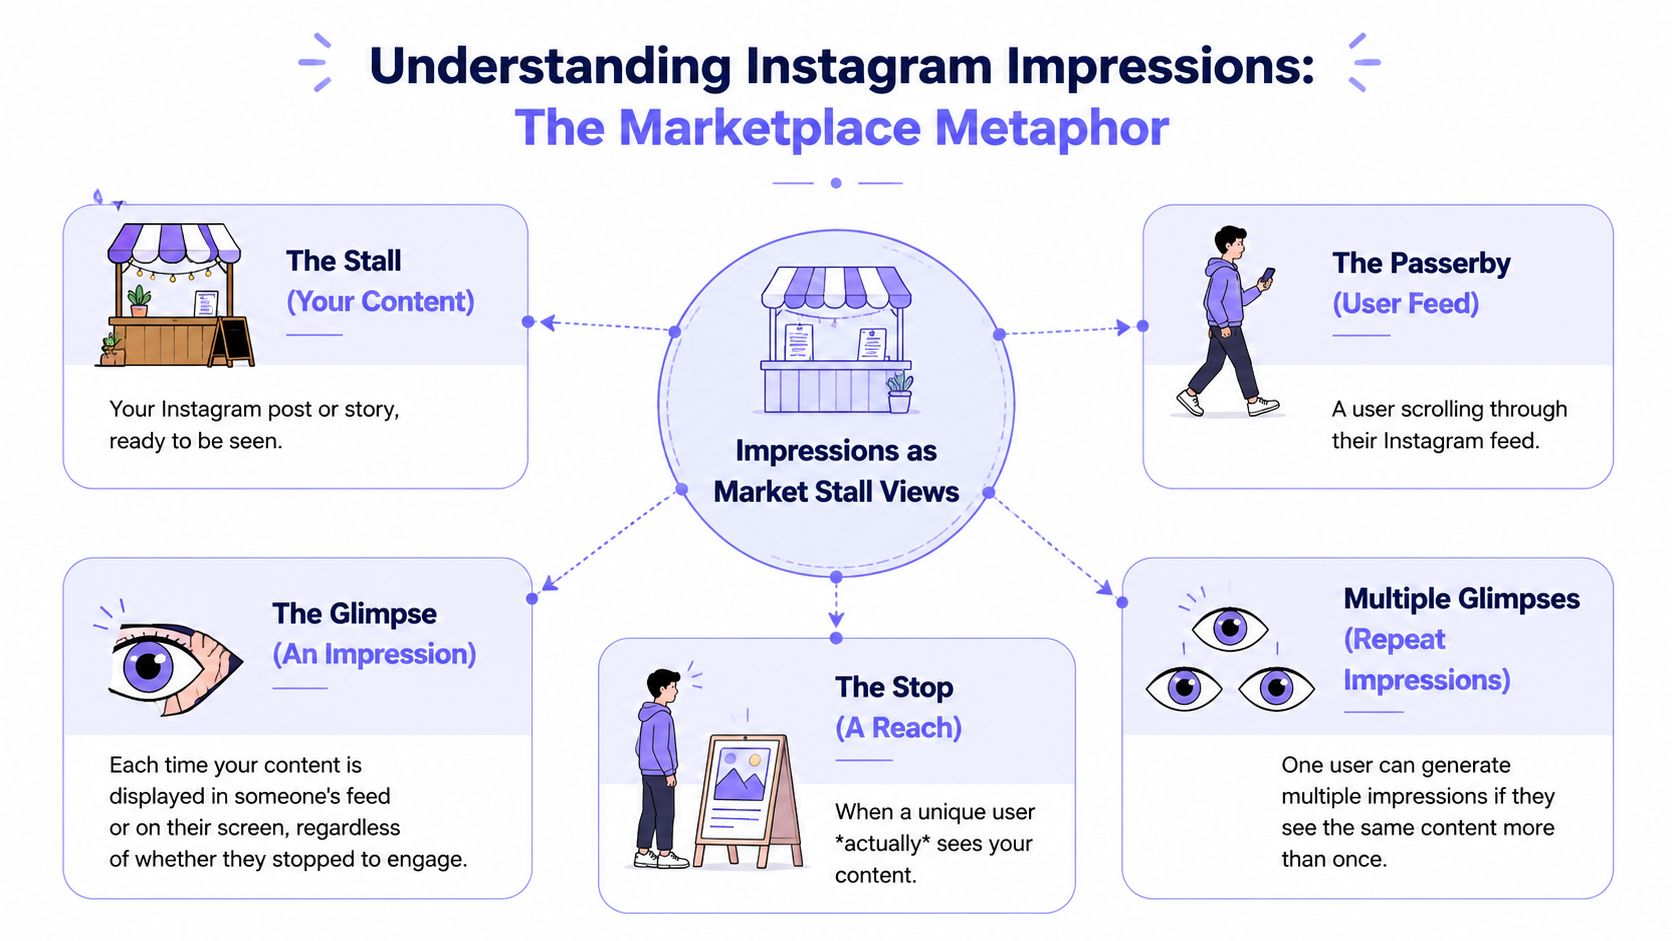 An infographic explaining Instagram impressions using a marketplace metaphor involving stalls, passersby, and multiple views.
Instagram's scale is part of why the metric exists in the first place. Statista's Instagram usage data places the platform at over 2 billion monthly active users worldwide as of early 2025, which makes repeated exposure meaningful at the top of the funnel. On a platform that large, content can be shown again and again across feed, profile, and other discovery paths, so impressions tell you about exposure volume, not just who was present.
If you want a broader framing beyond Instagram, MicroPoster's guide to social media impressions is a useful companion because it explains the same exposure concept across platforms. For Instagram-specific implementation details, it also helps to keep the platform context straight on the Instagram platform overview.
Why this metric exists at all
Instagram doesn't use impressions to answer "how many people know about this?" It uses impressions to answer "how much delivery happened?" That's a different question, and it's valuable when you're debugging visibility.
Use impressions when you need to reason about:
Repeat exposure: the same account encountering the same content more than once
Placement volume: whether content is appearing often enough to matter
Paid delivery analysis: especially when frequency matters
Impressions are about exposure pressure. Reach is about audience breadth.
That difference is the part many marketing writeups blur. For developers, the distinction matters because your schema, labels, and chart descriptions need to encode the platform's actual semantics, not the story someone wishes the metric told.
Impressions vs Reach vs Engagement The Metrics That Matter
These three metrics answer different questions. If you put them on the same chart without explaining their jobs, you'll create a dashboard that looks polished and still misleads people.
Use the right metric for the right question
On Instagram, impressions are a frequency metric, not a unique audience metric. Wpromote explains that the same account can contribute multiple impressions if content is shown repeatedly, which is why impressions are typically higher than reach and why the metric is useful for evaluating repeat visibility, especially in paid placements. See Wpromote's breakdown of Instagram reach vs impressions.
That gives you a reliable rule for product design:
Reach answers how many unique accounts saw this.
Impressions answers how many total times this was shown.
Engagement answers what people did in response.
If your stakeholder wants discoverability, reach usually belongs in the headline. If they want visibility pressure or ad delivery diagnostics, impressions belongs there. If they want content quality, neither reach nor impressions is enough on its own.
For deeper thinking on what interaction metrics tell you, PostNitro's guide to analyze Instagram engagement is worth reading alongside your metric definitions.
A simple comparison table
Metric | What It Measures | Key Question It Answers |
Impressions | Total times content was shown | How much total exposure did this content get? |
Reach | Unique accounts that saw content | How many distinct accounts did this content reach? |
Engagement | Interactions with the content | Did the content resonate enough for people to act? |
A useful implementation detail for dashboards is to avoid calculating fake relationships between these metrics unless the product explicitly supports them. Developers love derived metrics. Stakeholders love ratios. But if the source platform is shifting metric availability by content type, derived values can become unstable fast.
Don't let one metric stand in for another. High impressions with weak engagement tells a different story than high reach with strong engagement.
Practical Tactics to Increase Your Impressions
If your job includes building tools for creators or brands, you'll eventually get the product question: "What should users do to raise impressions?" The honest answer is not "post more." It is "increase the number of times Instagram has a reason to show the content."
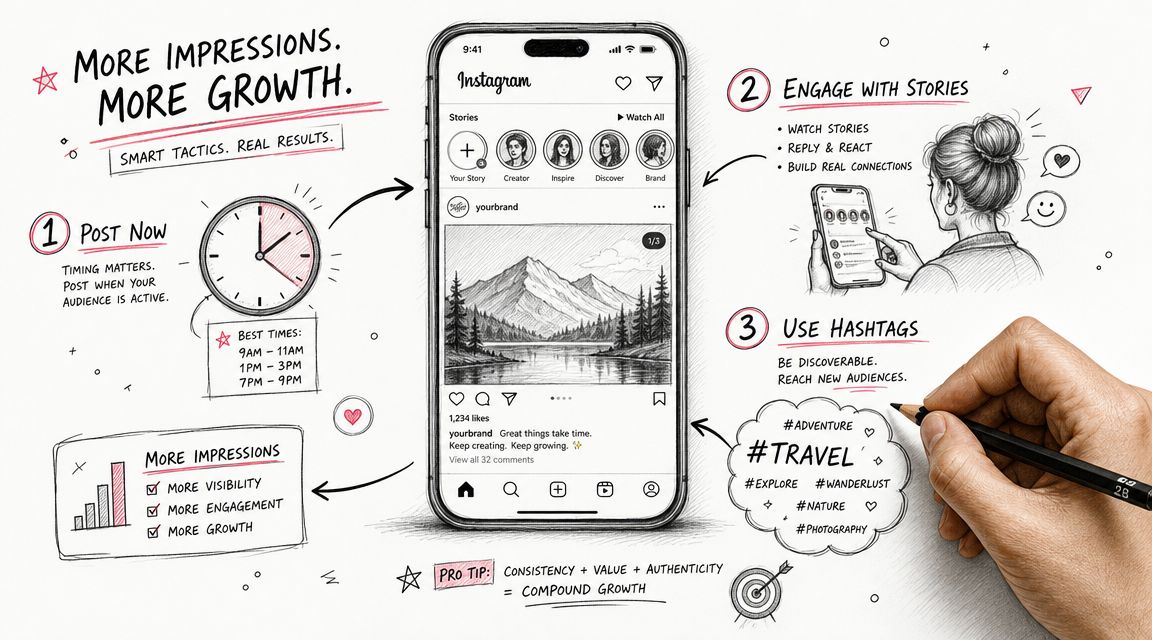 A hand-drawn illustration showing three key strategies for increasing Instagram impressions and profile growth.
Increase the number of discovery surfaces
Some tactics work because they create more possible entry points:
Use a mix of broad and niche hashtags. The point isn't magic keyword stuffing. The point is creating more relevant discovery paths where the content can appear.
Publish in formats Instagram tends to distribute widely. In practice, teams often prioritize Reels when they want more visibility because short-form video has strong discovery potential.
Collaborate with other accounts. Cross-posting, partner tags, and creator collaborations put the same asset in front of adjacent audiences and can create repeat exposure.
What doesn't work well is treating impressions like a metric you can brute-force with random posting volume. More posts can create more inventory, but low-signal posts often dilute attention and muddy your reporting.
Improve the odds of repeat visibility
Other tactics work because they encourage Instagram to keep circulating the same content:
Respond to comments quickly. Fast interaction can help keep a post active in conversation and visible for longer.
Write hooks that earn a stop. Even though an impression can happen without engagement, content that gets attention tends to stay in circulation longer.
Distribute the same idea across multiple placements. A strong post can be adapted into a Story, a Reel cut, or a profile pin, which increases the chance the same account encounters it again.
The shift occurs when frequency becomes a product behavior, not just a metric artifact.
A practical explainer worth embedding for non-technical teammates is below.
What usually fails
The common misses are predictable:
Chasing exposure without relevance. Content can rack up display events and still fail to matter.
Optimizing only for one surface. Feed-only thinking leaves discovery opportunities on the table.
Ignoring repeat-view intent. Some campaigns need broad unique reach. Others benefit from the same person seeing the message multiple times. Teams often don't decide which one they want.
If you're building product guidance around impressions, frame tactics around distribution mechanics, not generic motivation.
How to Track and Report Impressions Programmatically
The manual baseline is still useful. If you're validating your pipeline, first compare your API output against what the account owner sees in Instagram Insights or, for ads, in Meta Ads Manager. That won't solve every mismatch, but it helps separate ingestion bugs from metric-definition problems.
Start with the native product behavior
For a single account, native Insights gives you the human reference point. It's the place to confirm whether a number exists, whether a metric label has changed, and whether the UI is presenting something different from what your reporting model expects.
Then the main work starts. Programmatic reporting means handling multiple accounts, inconsistent metric availability, and payloads that don't always map neatly across content types.
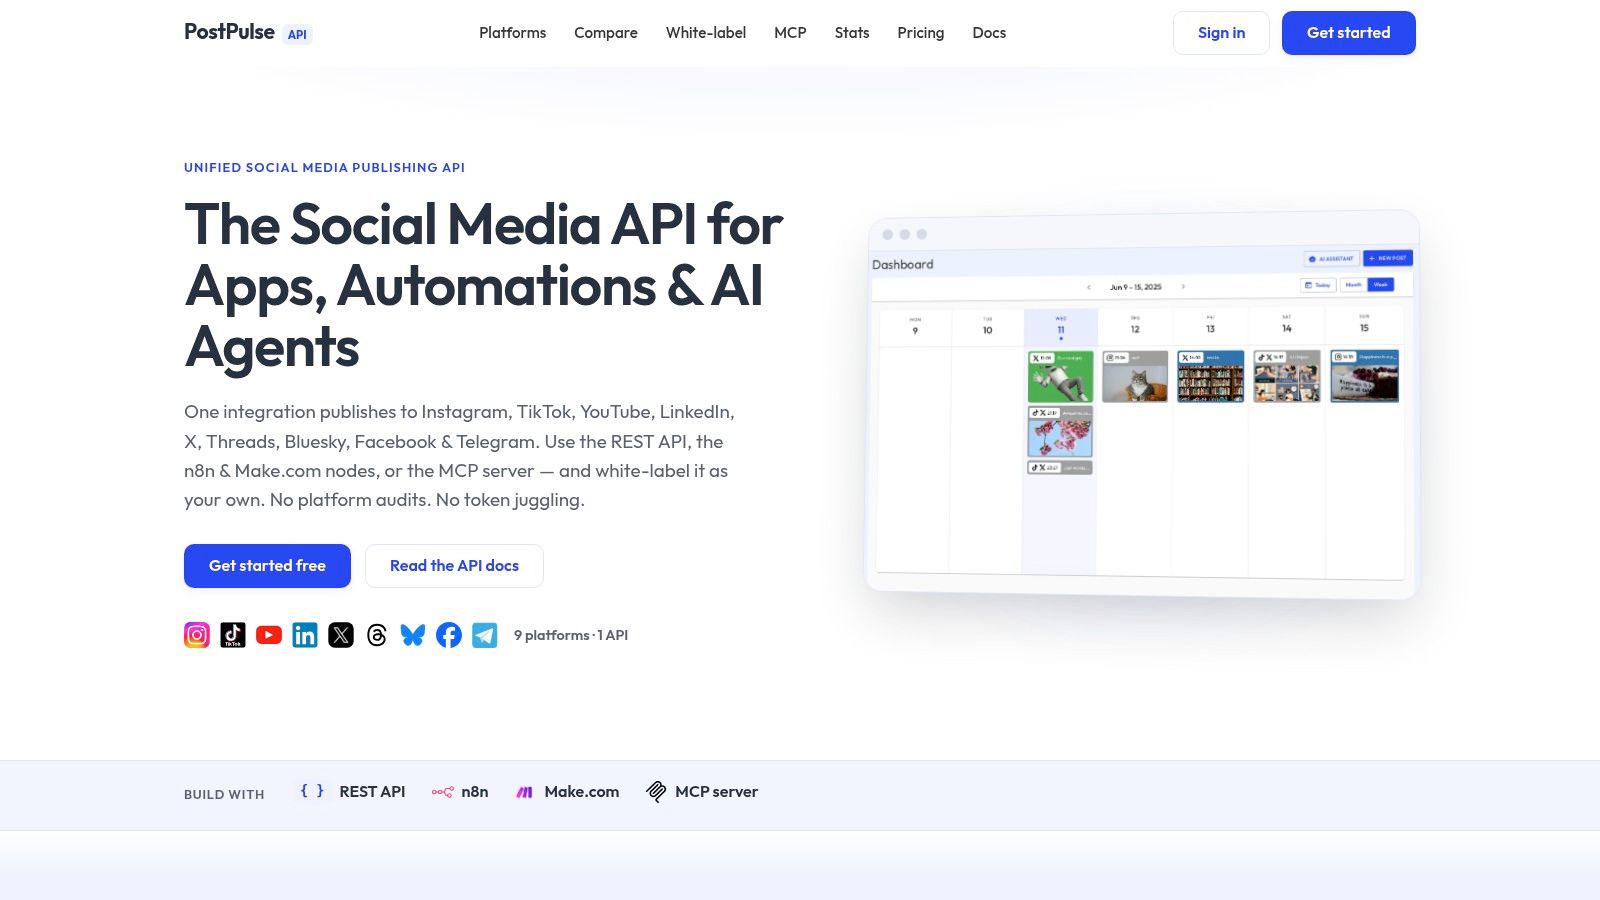 Screenshot from https://post-pulse.com
Build your reporting model around metric availability
If you're building this yourself, the key is to model metrics as optional, typed fields rather than assuming one universal "instagram_impressions" value exists everywhere forever.
A practical reporting layer usually needs:
Metric provenance: was this value from organic insights, ad reporting, or a transformed view metric?
Content-type awareness: Reel, Story, post, profile, ad
Availability flags: present, deprecated, unsupported, or not returned
UI labels that match semantics: "Total displays" is often clearer than a bare "Impressions"
For implementation teams that want a unified reference for social API workflows, the API docs for PostPulse show the kind of normalized integration surface many developers prefer when they don't want to hand-maintain every platform quirk themselves.
A good social dashboard doesn't just store numbers. It stores what those numbers mean, where they came from, and when they stopped being comparable.
Reporting patterns that hold up
A few patterns make these dashboards less fragile:
Separate organic and paid reporting paths. They may share labels but often don't share operational meaning.
Version your metric definitions. Social platforms change terms and availability. Your app should preserve historical interpretation.
Expose caveats in the UI. A tiny tooltip can save hours of support tickets.
The engineering work isn't just fetching data. It's defending users from false equivalence.
Common Measurement Mistakes to Avoid
The biggest mistake is assuming impressions are a stable, always-available metric for every Instagram reporting scenario. They aren't.
Treating impressions as a universal metric
Sprout Social notes that as of 2025, Meta has deprecated organic impressions in Instagram's core interface for some content types and shifted analysis toward Views, while paid impressions remain available in Meta Ads Manager. Their summary on Instagram impressions and metric changes is the important warning sign for developers: organic benchmarking may need to use views or reach, while ad optimization still depends on impression delivery.
That creates an awkward but important split in your data model. Organic and paid may use related language, but they are no longer symmetric enough to treat as interchangeable.
Reporting raw counts without context
Other mistakes are less dramatic but still expensive:
Confusing reach with impressions in labels. This is the fastest way to break stakeholder trust.
Mixing content types without caveats. If one type reports views and another reports impressions, your rollups need clear rules.
Ignoring placement context. An impression from repeated exposure tells a different story than first-time discovery.
Forgetting auth lifecycle issues. A missing metric can be a platform change, but it can also be an expired connection. If you're debugging the plumbing side, PostPulse has a useful explainer on the Meta OAuth token lifecycle.
When a metric disappears, don't patch over it with zeros. Mark it unavailable and explain why.
The safest mindset is to treat Instagram metrics as evolving interfaces, not fixed database columns. Build with fallback logic, preserve source meaning, and never let a chart imply comparability that the platform no longer supports.
If you're tired of stitching together social publishing and reporting logic account by account, PostPulse is worth a look. It gives developers one integration surface for social workflows, handles the token and platform-change headaches for you, and fits well whether you're building a SaaS feature, an internal tool, or an automation stack.
Published via the Outrank app
About the Author

Founder of PostPulse — a social media scheduling platform for creators and teams. Software engineer with a passion for building developer tools and simplifying complex API integrations across social media platforms.