
How to Evaluate Limits Without Breaking Your API
Published on
Tags:
Your automation worked in staging. Then a customer queued a batch, one token expired halfway through, a publish endpoint started returning 429s, and your retry loop made it worse by replaying the same request burst. That's the moment you realize “limits” aren't just a row in the docs.
If you build against social APIs, how to evaluate limits is an operational discipline. You read the docs first. Then you verify what the platform enforces at the endpoint, token, account, and concurrency level. If you skip that second part, you ship guesswork.
The same thing shows up in other systems too. Teams that work with model APIs run into the same gap between documented allowance and real-world throughput, which is why resources like code limits for GTM teams are useful context even outside social publishing. The shape of the problem is the same: the published rule is only part of what your product has to survive.
Table of Contents
Why Evaluating Limits Breaks Most Automations
A lot of automations fail because developers treat limits as a static lookup problem. They find a quota page, note the obvious cap, and move on. That works until production traffic arrives in clumps instead of a smooth stream.
Real failures usually look messier. A queue drains too fast after a worker restart. A scheduled campaign sends many requests to the same endpoint at once. An OAuth token that looked fine during a short test expires while jobs are still waiting. None of that feels exotic when you've run a production integration for any length of time.
Documented limits are only one layer
Platforms typically expose some combination of published quotas, endpoint-specific restrictions, and response-time signals such as throttling headers. Your app also creates its own limits through worker concurrency, queue configuration, and retry behavior. If you only model one layer, the others bite you later.
Practical rule: If your first rate-limit strategy is “we'll see what happens,” your users become the test harness.
This is why evaluating limits isn't just reading. It's reading, measuring, and validating assumptions under realistic traffic. The goal isn't to find the biggest number you can push. The goal is to know what breaks first, how early you can detect it, and how your system behaves before users notice.
Hidden pressure comes from your own architecture
I've seen integrations fail without any dramatic spike in total volume. The issue was burst shape, not daily usage. Ten background jobs firing at once can be more dangerous than a larger workload spread across time.
A few common self-inflicted problems show up over and over:
Parallel workers with no coordination flood a single endpoint from multiple processes.
Blind retries replay failed requests immediately, stacking load right on top of the original burst.
Shared tokens across many user actions create local hotspots that don't show up in coarse app-level dashboards.
Long queues with stale auth leave jobs waiting until credentials are no longer valid.
When developers ask why a carousel container sits in progress forever or why a token dies after an hour, they're usually staring at a symptom. The root cause is almost always poor limit evaluation before launch.
Finding the Real Limits in Official Documentation
The first job is boring and necessary. Build a source-of-truth inventory from official documentation only. If the docs don't state a limit, don't invent one. Treat anything undocumented as unknown until your own controlled tests and response inspection tell you how the platform behaves.
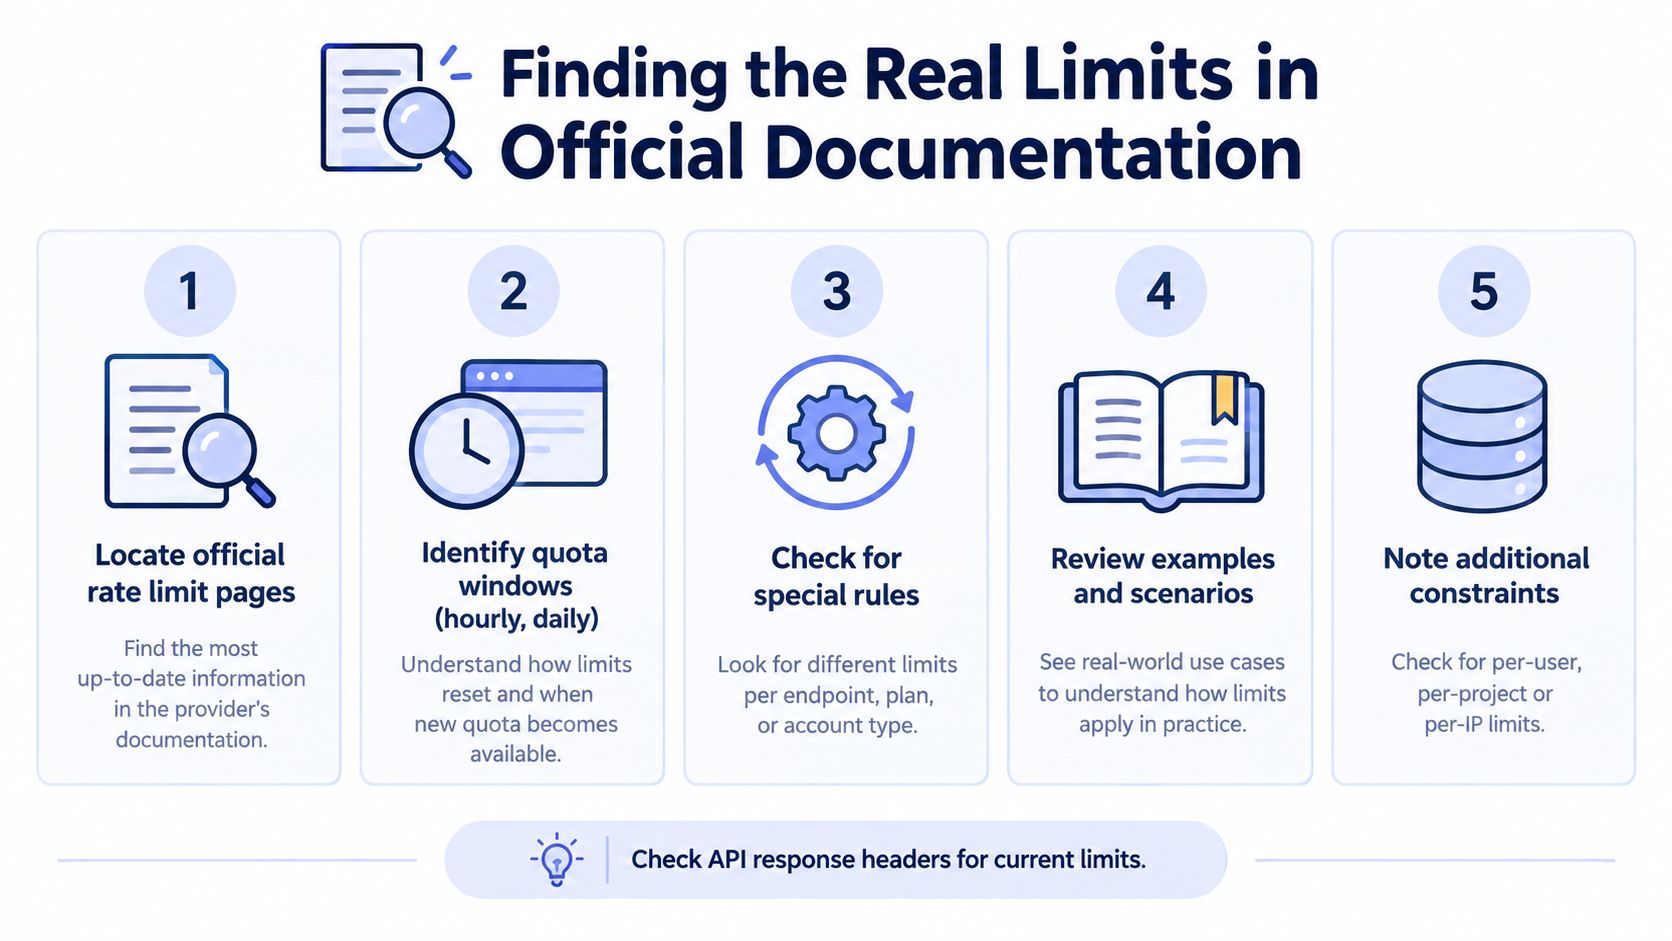 A five-step guide for developers on finding and understanding API rate limits within official documentation.
Start with endpoint-level docs, not blog summaries
Official docs often separate general app quotas from endpoint-specific rules. If you only read the overview page, you miss the restriction that governs your workflow. Publishing, media upload, status polling, and account lookup may all behave differently.
Build a small inventory for each integration:
Endpoint name and version. Record the exact path your app calls.
Auth model. Note whether the limit is per app, per user, per page, per token, or some combination.
Quota window. Capture whether the docs describe minute, hour, day, or rolling-window behavior.
Headers and error responses. Save examples from live calls.
Changelog owner. Someone on the team needs to watch version updates.
If you want a clean process for maintaining that inventory, these API documentation best practices are a good template for turning scattered vendor docs into an internal system people use.
Read the headers like they matter, because they do
A limit page tells you policy. Response headers tell you current state. When an API returns Retry-After, X-RateLimit-Remaining, reset timestamps, or related metadata, those headers belong in your client logic and your logs.
What works:
Persisting header values with each request record
Comparing documented behavior to observed headers
Separating success-path and throttle-path logging
Validating headers by endpoint, not assuming every route returns the same shape
What doesn't work:
Hardcoding a guessed sleep duration
Assuming all 429s mean the same thing
Applying one backoff rule to every endpoint
Reading docs from the wrong API version
If the docs are silent on a hard limit, say “unknown” in your design doc. Unknown is honest. Guessed numbers become production bugs.
Version drift is a real limit bug
A surprising amount of limit pain is version drift. Teams copy examples from old forum posts, wire up a deprecated endpoint, or implement headers from an earlier revision. Then they spend days “debugging limits” that are really documentation mismatches.
Formal limit notation itself only became standardized over time. The modern concept grew from the Greek method of exhaustion used by Archimedes and Euclid, became more explicit in the seventeenth century with work by Grégoire de Saint-Vincent and Isaac Newton, and reached the familiar epsilon-delta form through Bolzano and Weierstrass over roughly 2,000 years of development, as summarized in the history of limits in mathematics). In practice, software teams need the same mindset: before you compute anything confidently, you need precise definitions.
That also explains why standard evaluation methods depend on shared formal language. Historical work on notation and definition, including the use of lim, Cauchy's modern verbal definition in 1821, and Weierstrass's later epsilon-delta formulation, gave mathematics the precision needed to evaluate limits consistently, as outlined by the history of calculus notation and symbols. API integrations need that same rigor with quota definitions, windows, and headers.
A useful parallel exists in AI pricing systems too. When teams study something like the RapidNative token economy, they're really learning the same lesson: before you optimize usage, you need to understand exactly what unit is being measured and billed.
How to Measure and Test Your Actual Usage
Once you've mapped the official rules, stop theorizing and instrument the integration. You need to know how many requests you make, where they come from, which identity they burn against, and what the API says back when you approach a limit.
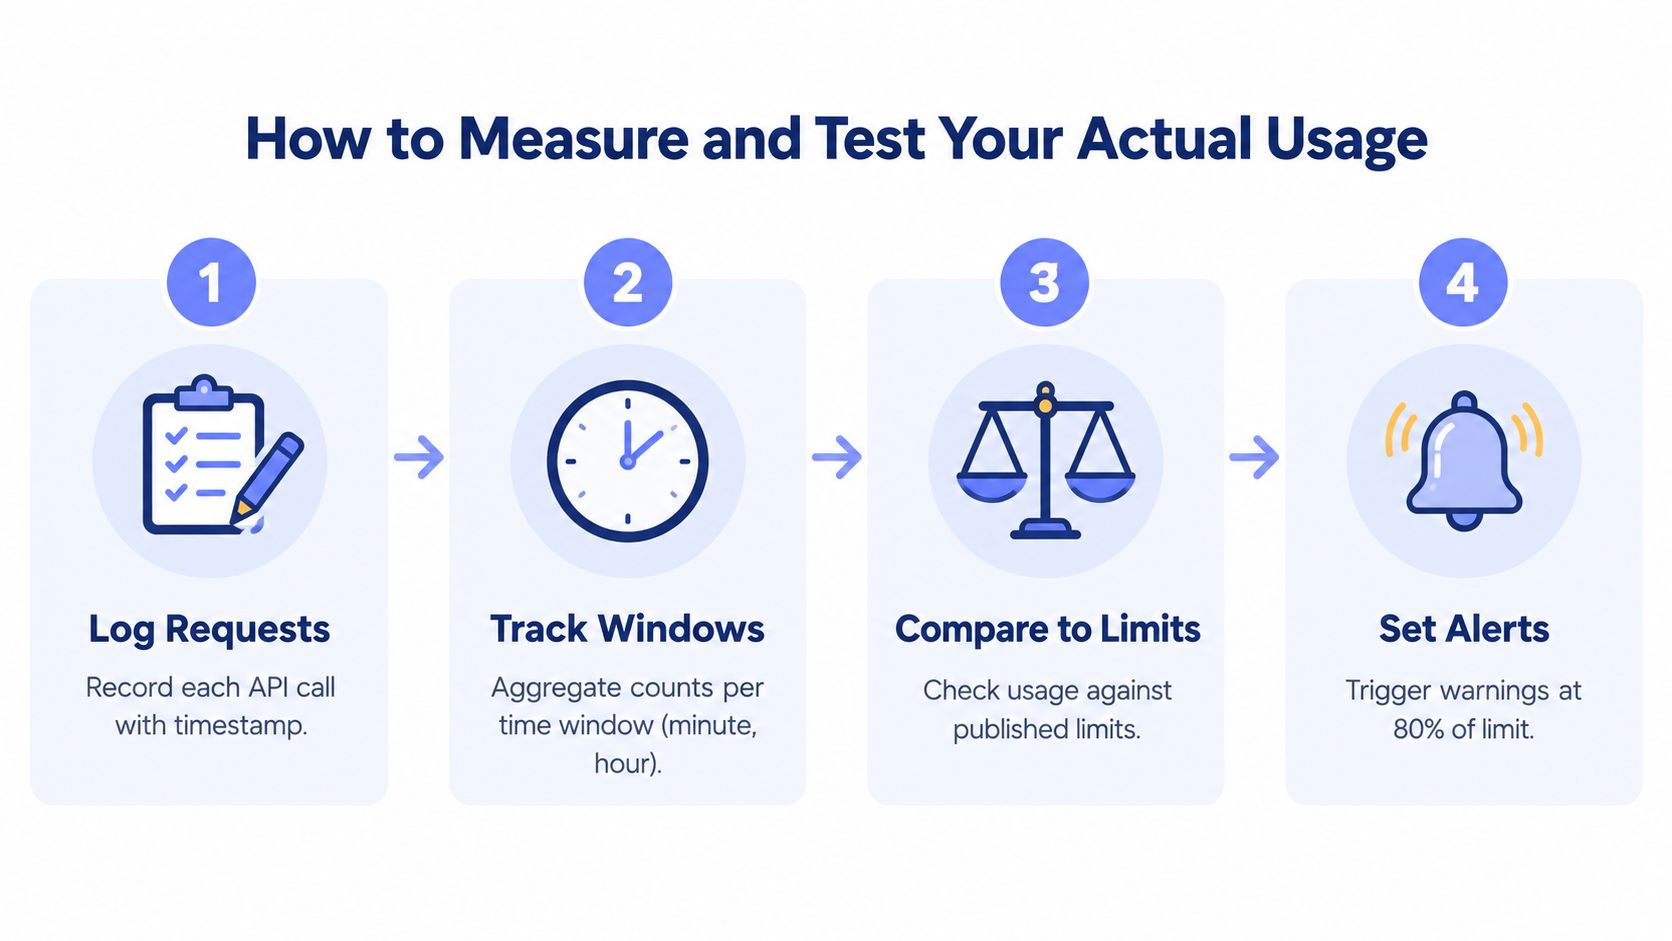 A four-step infographic illustrating how to monitor and manage API usage limits using clear icons and text.
Log usage in a way you can actually query
Basic request logs aren't enough. You want structured events that let you answer operational questions quickly.
Track fields like these for every outbound call:
Endpoint and method so you can isolate hot routes
Platform account identifier to distinguish per-account pressure from app-wide pressure
Auth context such as token or connection record
Timestamp and queue latency so you can see burst shape
Response code and relevant headers for near-limit analysis
This doesn't need to be fancy on day one. A clean event table or log stream is enough if you can group by endpoint, account, and window. The important part is consistency.
Test bursts, not just totals
Most developers test happy-path throughput. They queue a few calls, see successful responses, and assume they're safe. Production doesn't arrive that way.
Run controlled tests that mimic the patterns your product will create:
A scheduled burst where many jobs fire at the same minute
A retry storm where failed requests get re-queued
A polling-heavy workflow that checks media status repeatedly
Mixed workloads where reads, writes, and status checks compete for the same budget
Use a staging environment when the platform provides one. If it doesn't, use low-risk synthetic traffic against noncritical accounts and stop well before you create user-visible problems. The point is to discover shape-related failures safely.
For broader integration discipline, I like this guide to cross-platform testing for API workflows because it pushes teams to verify the whole path, not just isolated requests.
The question isn't “Can this request succeed?” The real question is “What happens when fifty ordinary product actions land in the same minute?”
Build headroom from observed behavior
You won't always get a nice published number for every moving part, so use measurement to define operational headroom. If header values drop sharply during common user flows, treat that as a warning even when requests still succeed.
A practical testing loop looks like this:
Baseline normal behavior. Measure a typical publishing run.
Increase concurrency carefully. Raise worker count or batch size in small steps.
Watch for leading indicators. Header changes, queue delay, and status polling spikes usually appear before outright failure.
Record recovery behavior. How long until the system returns to a stable state after a burst?
What usually fails first isn't the main publish call. It's often the supporting traffic around it: media checks, account verification, retries, or duplicate submissions after user impatience.
Handling Throttling With Backoff and Retry Logic
Once you know where your pressure points are, you need a throttle strategy that fits the integration. There isn't one winner for every case. A no-code workflow in n8n or Make behaves differently from a custom worker fleet calling a REST API directly.
Start with the response, not your intuition
If the platform sends Retry-After, respect it. Don't replace it with your favorite exponential formula. The server is telling you when to come back.
When no explicit recovery header exists, use a conservative retry policy and pair it with idempotency controls where the API supports them. Otherwise your recovery code becomes a duplication engine.
Here's a compact way to choose:
Strategy | How It Works | Best For | Watch Out For |
Fixed delay | Waits the same interval before each retry | Low-volume automations and simple no-code flows | Can synchronize retries into new bursts |
Exponential backoff | Increases delay after each failure | Direct API clients and worker-based systems | Too aggressive a base interval still causes pain |
Exponential backoff with jitter | Adds randomness to spread retries out | Multi-worker systems and shared queues | Harder to reason about in logs without good tracing |
Queue smoothing | Releases jobs at a controlled rate | Scheduled publishing and bulk operations | Needs a queue that understands platform/account boundaries |
Concurrency caps | Limits simultaneous in-flight requests | APIs with sensitive burst behavior | Throughput can drop if caps are too blunt |
The strategy trade-offs are operational
Fixed delay is easy to implement and easy to explain. It's also the first thing that collapses under synchronized retries. If ten jobs fail together and all wait the same amount of time, they usually fail together again.
Exponential backoff is better because it creates breathing room. Add jitter and it becomes much safer for distributed workers. That's the default I trust for direct API clients unless the docs provide a stronger server-side hint.
Queue smoothing solves a different problem. It's not really a retry strategy. It's burst prevention. If your product schedules a lot of publishes for the top of the hour, a queue that meters dispatch often does more good than any retry policy after the fact.
For a deeper implementation checklist, these rate limiting best practices are worth keeping next to your client code.
Retry less often than you think
A lot of teams over-retry because failed publishes feel urgent. But not every failed request should be retried immediately, and some shouldn't be retried automatically at all.
Use different handling for different cases:
Throttle responses should usually delay and retry.
Expired or invalid tokens should trigger refresh or reauth logic, not blind replay.
Validation failures should stop the job and surface a useful error.
Long-running media workflows should poll with caps instead of hammering status endpoints.
One useful option, if you don't want to maintain platform-specific OAuth, refresh, and limit handling yourself, is PostPulse, which provides a unified publishing API and automation nodes across multiple social platforms. That kind of abstraction doesn't remove the need for testing, but it can reduce the amount of custom retry and token code your team owns.
Monitoring Limits and Preventing Failures in Production
You don't solve limit handling at launch and move on. Platforms change behavior, your product adds new traffic patterns, and one successful campaign can expose a queue shape you never tested.
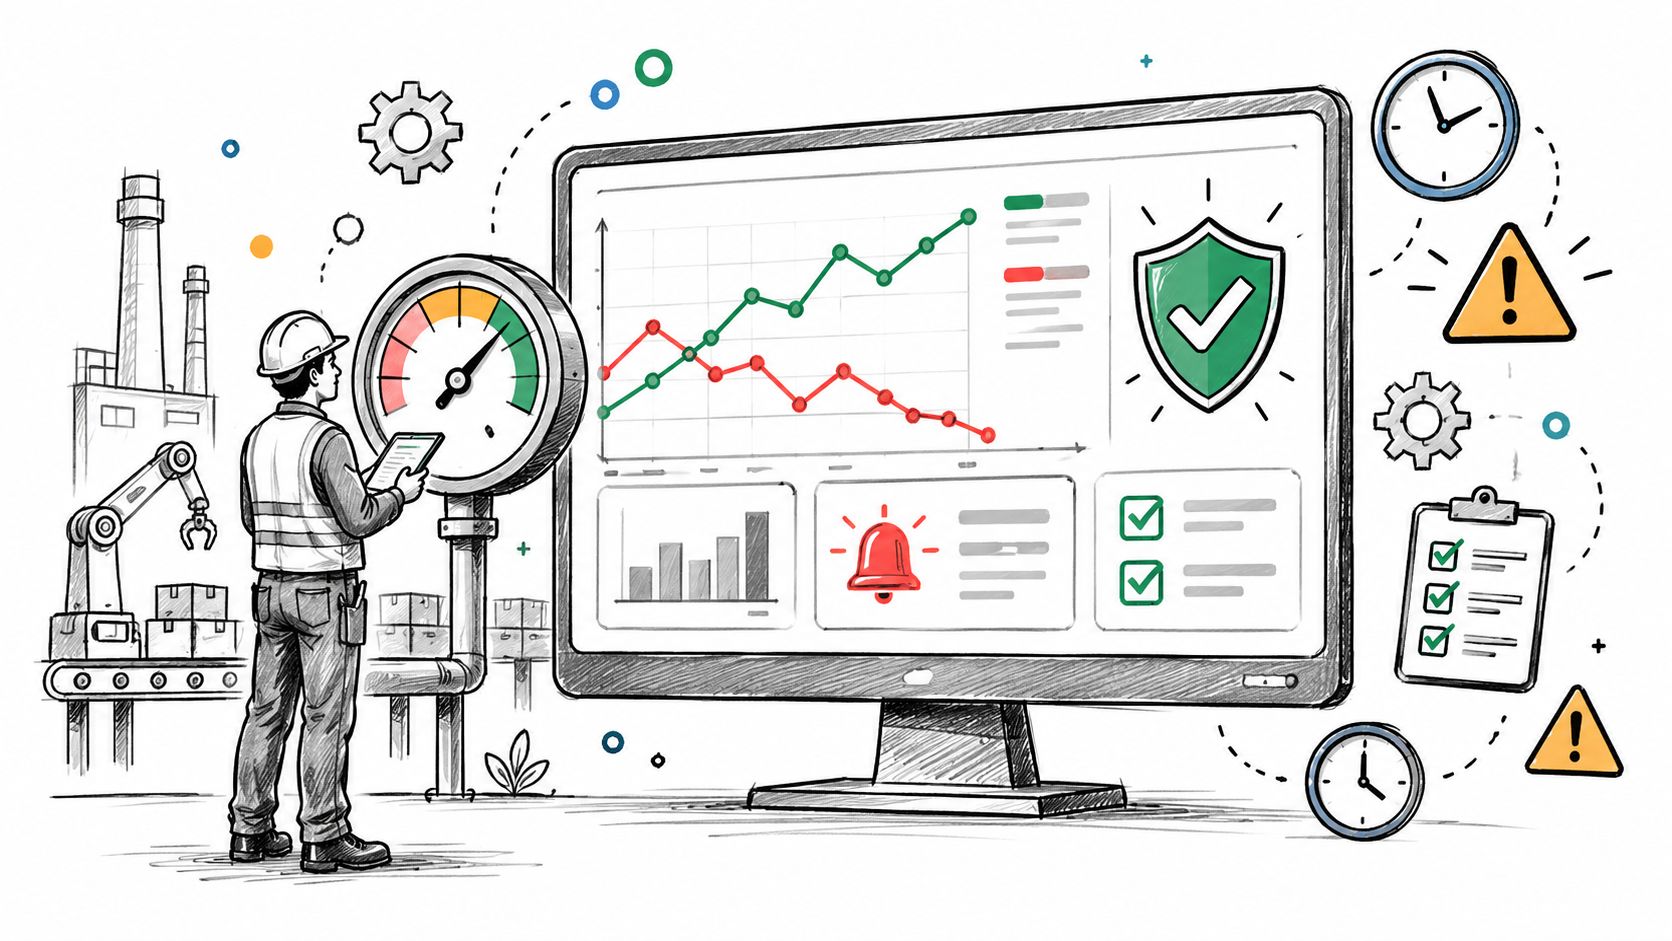 An industrial worker inspecting a factory monitoring dashboard with graphs and safety alerts on a screen.
Watch the leading indicators
The most useful dashboards don't start with total request count. They start with pressure signals that tell you a failure is coming.
Monitor things like:
Near-limit header trends on the endpoints that matter most
429 and related throttle responses grouped by endpoint and account
Queue age so you can spot work piling up behind retries
Token refresh failures that can strand jobs mid-flow
Duplicate publish attempts after retries or user re-clicks
A practical threshold is to alert before the hard wall, not at it. Many teams choose warning thresholds in the 70 to 80% range of a known limit because that leaves room for spikes and retries. If you use a threshold like that, make sure it comes from your own operational policy and the published platform rule, not from a guessed undocumented cap.
Correlate by account and endpoint
App-wide metrics hide local failures. One noisy customer or one expensive endpoint can create the bulk of your incidents while the aggregate dashboard looks fine.
Operating advice: If you can't answer “which account, which endpoint, which window,” you don't have rate-limit monitoring yet. You have a graph.
Observability basics matter more than fancy architecture. A straightforward guide to app observability for indie hackers is useful because it focuses on the mechanics that help during incidents: structured logs, alert routing, and traces you can follow under pressure.
Production resilience comes from shaping traffic
The strongest systems smooth traffic before the platform has to reject it. They batch where the API allows batching. They queue publishes rather than letting user actions hit the API directly. They separate token refresh pipelines from content dispatch. They also keep per-platform behavior isolated so one provider's trouble doesn't stall every outgoing post.
That's the difference between an integration that merely works and one that stays calm under campaign load.
Putting Your Limit Strategy Into Practice
A solid limit strategy is a loop. Read official docs. Measure real usage. Handle throttling deliberately. Monitor production pressure. Teams that skip one of those steps usually end up compensating with support tickets and one-off patches.
If you're deciding what to do this week, keep it simple:
Audit one publish path end to end. Pick the busiest workflow you own.
List the official limit sources. If a rule has no documentation, mark it unknown.
Instrument request headers and queue timing. You need observed behavior, not assumptions.
Choose one backoff policy intentionally. Don't let retries emerge by accident from library defaults.
Add production alerts before users complain. Monitor pressure, not just outright failure.
Teams should build this themselves when platform behavior is central to their product and they want direct control over every edge case. They should offload it when social publishing is a feature, not the company's core engineering problem.
The main mistake is waiting until a failed launch to learn how to evaluate limits. Run the audit now, while you can still change queue design, retry rules, and token handling without a customer outage.
If you'd rather spend time on product logic than on OAuth refreshes, version drift, and platform-specific throttling behavior, PostPulse gives you one publishing surface for multiple social platforms through a REST API, automation nodes, and an MCP server. It's a practical way to reduce the amount of limit-handling code your team has to maintain while still testing the workflows that matter to your users.
About the Author

Founder of PostPulse — a social media scheduling platform for creators and teams. Software engineer with a passion for building developer tools and simplifying complex API integrations across social media platforms.