
Click Through Rate Optimization: A Developer's Guide
Published on
Tags:
You shipped the campaign, wired up the posts, and watched the dashboard like a deployment log. One platform says clicks are up, another says reach fell, and someone asks why your click through rate moved when you didn't change the copy. That moment is familiar to anyone who's ever untangled expiring tokens, stuck publishing containers, and three different analytics definitions before lunch. Real click through rate optimization starts there, with instrumentation, not with a punchier headline.
Table of Contents
Why Organic Search, Email, Paid Social, and Organic Social Are Different Games
Instrumenting Multi-Platform Experiments With One Publishing Layer
The Headline Number Problem Nobody Questions
A developer I swapped notes with once spent a week chasing a CTR drop that never happened. His team had shipped the same campaign to search, email, and social, then stitched the results into one spreadsheet. Search divided clicks by impressions, one social report divided clicks by reach, and email divided clicks by delivered messages. The merged number moved, so everyone assumed the creative had failed.
Nothing had failed except the comparison. The variants went out at different times, through different code paths, to audiences that weren't equivalent. When the team rebuilt the report with one label per surface, the mysterious drop turned into three separate stories, only one of which needed a fix.
Four Metrics Wearing One Name
Ad CTR, organic search CTR, email click rate, and social post CTR sound interchangeable in a standup. They aren't. Each surface decides what counts as an impression, who enters the population, and which external forces can move the result before your message gets a chance.
Organic search: Ranking position and SERP layout shape whether anyone sees a clickable result at all.
Email: Deliverability, list quality, and send conditions sit upstream of the click.
Paid media: Auction dynamics and audience matching influence who receives the impression.
Organic social: Platform distribution decides exposure before a hook or thumbnail can work.
Treating those as one metric produces confident, wrong decisions. You'll rewrite a title when position changed, blame a thumbnail when distribution narrowed, or celebrate an email lift caused by a cleaner segment.
Practical rule: If you can't state the numerator, denominator, population, and time window in one sentence, you don't have a CTR problem yet. You have a measurement problem.
Define Before You Optimize
Standardize the formula inside each surface, label the impression type, and decide your segments before launch. Query, device, platform, audience, and brand status belong in the reporting schema, not in a postmortem. That discipline connects directly to setting social marketing goals that map to measurable actions, because a goal like "more clicks" doesn't tell an engineer what event to log.
Write the definition down where the team ships work. Store impressions, clicks, variant ID, publish timestamp, and destination together. Once those fields exist, click through rate optimization becomes a set of testable questions instead of an argument about whose dashboard is lying.
How CTR Is Actually Calculated and Measured
Start with the canonical math and don't let any tool change it. Google Ads defines CTR as clicks divided by impressions, so 5 clicks from 100 impressions produces a 5% CTR. If you swap impressions for reach in one report, you've created a different metric and broken every comparison downstream.
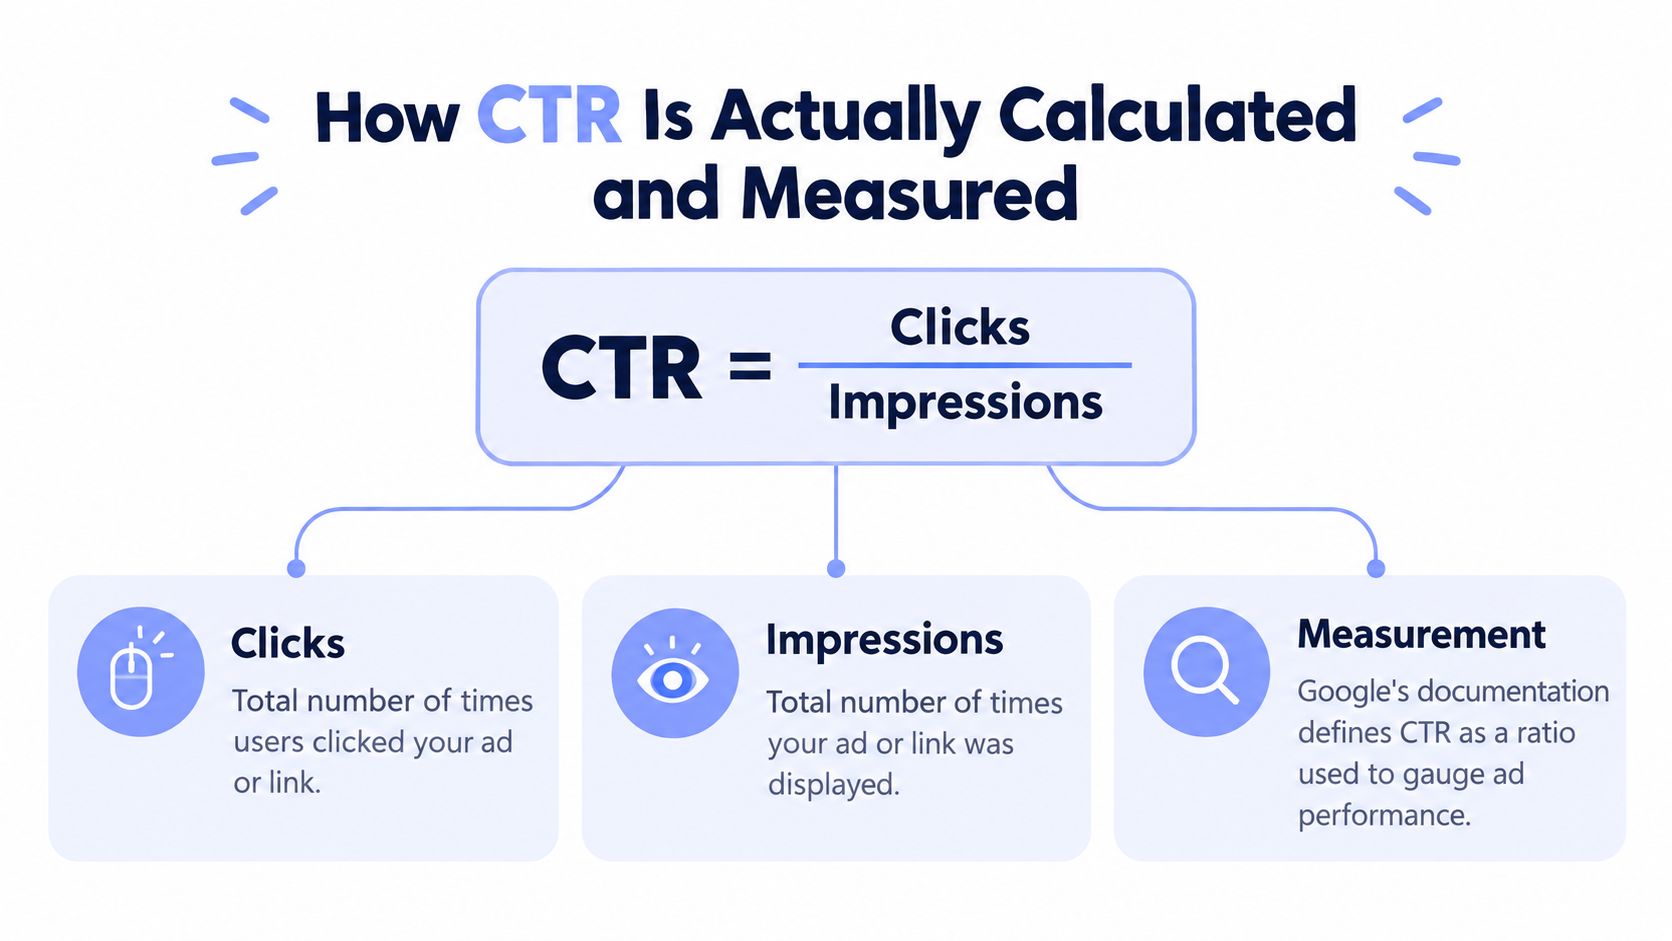 An infographic explaining the formula for calculating CTR as Clicks divided by Impressions for digital advertising.
The denominator deserves the same scrutiny as the headline number. Google AdSense documentation defines ad CTR using individual ad impressions, where 5 clicks from 1,000 ad impressions equals 0.5%. Same clicks, wildly different rate. That's why reports need labels like ad impressions, search impressions, delivered emails, or post impressions, never a bare "CTR."
Actual CTR Versus Expected CTR
Actual CTR is what happened. Expected CTR is a prediction. Google distinguishes observed actual CTR from expected CTR based on historical keyword performance, and at auction time it recalculates that estimate using search terms, device type, and other auction factors. Confusing a forecast with observed behavior leads teams to "fix" ads that were never shown under comparable conditions.
Segment before you judge. A blended account average hides the exact variation you need to see:
Query or keyword: Intent changes what a good result looks like.
Device: Layout, screen space, and user context differ materially.
Surface and format: A video view, search result, and inbox placement aren't equivalent exposures.
Time window: Compare equivalent periods so seasonality doesn't impersonate creative impact.
Read the Chart Like an Engineer
For organic results, Google Search Console describes CTR as clicks divided by impressions and links a high rate to a result appearing to match what users searched for. Its guidance points you toward underperforming query and page pairs, then toward the titles and snippets users saw. That's a diagnostic workflow, not an invitation to average the whole site.
Build the same habit into social media reporting that separates platforms and denominators. Any chart should let you reconstruct the population, exposure definition, click definition, and date range. If it can't, send it back. Optimization on top of ambiguous telemetry is just guesswork with better formatting.
The Four Messaging Levers and What Each Actually Changes
Titles, descriptions, calls to action, and thumbnails aren't a copy checklist. They're message variables. Each changes a different part of the user's decision, and each can be isolated only if the other variables stay put while you test.
Titles and Descriptions Do Different Jobs
A title earns consideration by matching intent fast. Put the primary concept early, state the concrete benefit, and don't make the user decode cleverness before relevance. In search, that alignment matters because the user arrives with a question already formed, and your result either answers it visibly or gets skipped.
A meta description reduces uncertainty. It should clarify what the landing page contains, who it's for, and what happens after the click. Google's own Search Console guidance, covered above, tells publishers to inspect titles and snippets for underperforming queries and check whether they accurately answer the searcher's question. Rewrite for accuracy first, persuasion second.
Email subject lines work like titles in a narrower space, which is why small formatting choices deserve a test rather than a style argument. If you're deciding between sentence case and title case, this breakdown of email subject line capitalization is a useful reference before you lock a variant. Treat capitalization as one variable, not as a bundle with new wording.
CTAs and Thumbnails Control Commitment
A call to action shapes the moment of commitment. "Read the guide," "Connect your account," and "Start publishing" ask for different effort levels and attract different users. The winning CTA isn't always the one with the most clicks. It's the one whose promise matches the next screen closely enough that qualified users continue.
Thumbnails carry the decision where there's no snippet. On YouTube and social feeds, the image has to communicate subject, tension, and payoff before text gets read. Test one change at a time:
Subject clarity: Can a viewer name the topic without reading the caption?
Visual contrast: Does the focal element survive a small mobile crop?
Promise match: Does the opening content deliver what the thumbnail implied?
Change the title, thumbnail, and CTA together and you've learned nothing, even if CTR jumps. You've only learned that something in the bundle coincided with a better result.
That restraint feels slow, but it's faster than re-running muddled tests. Pick the lever closest to the suspected failure, hold the rest constant, and let the data indict or clear it.
Why Organic Search, Email, Paid Social, and Organic Social Are Different Games
A universal CTR benchmark is convenient and mostly useless. The four surfaces below reward different work, fail for different reasons, and put different confounders between your message and the click.
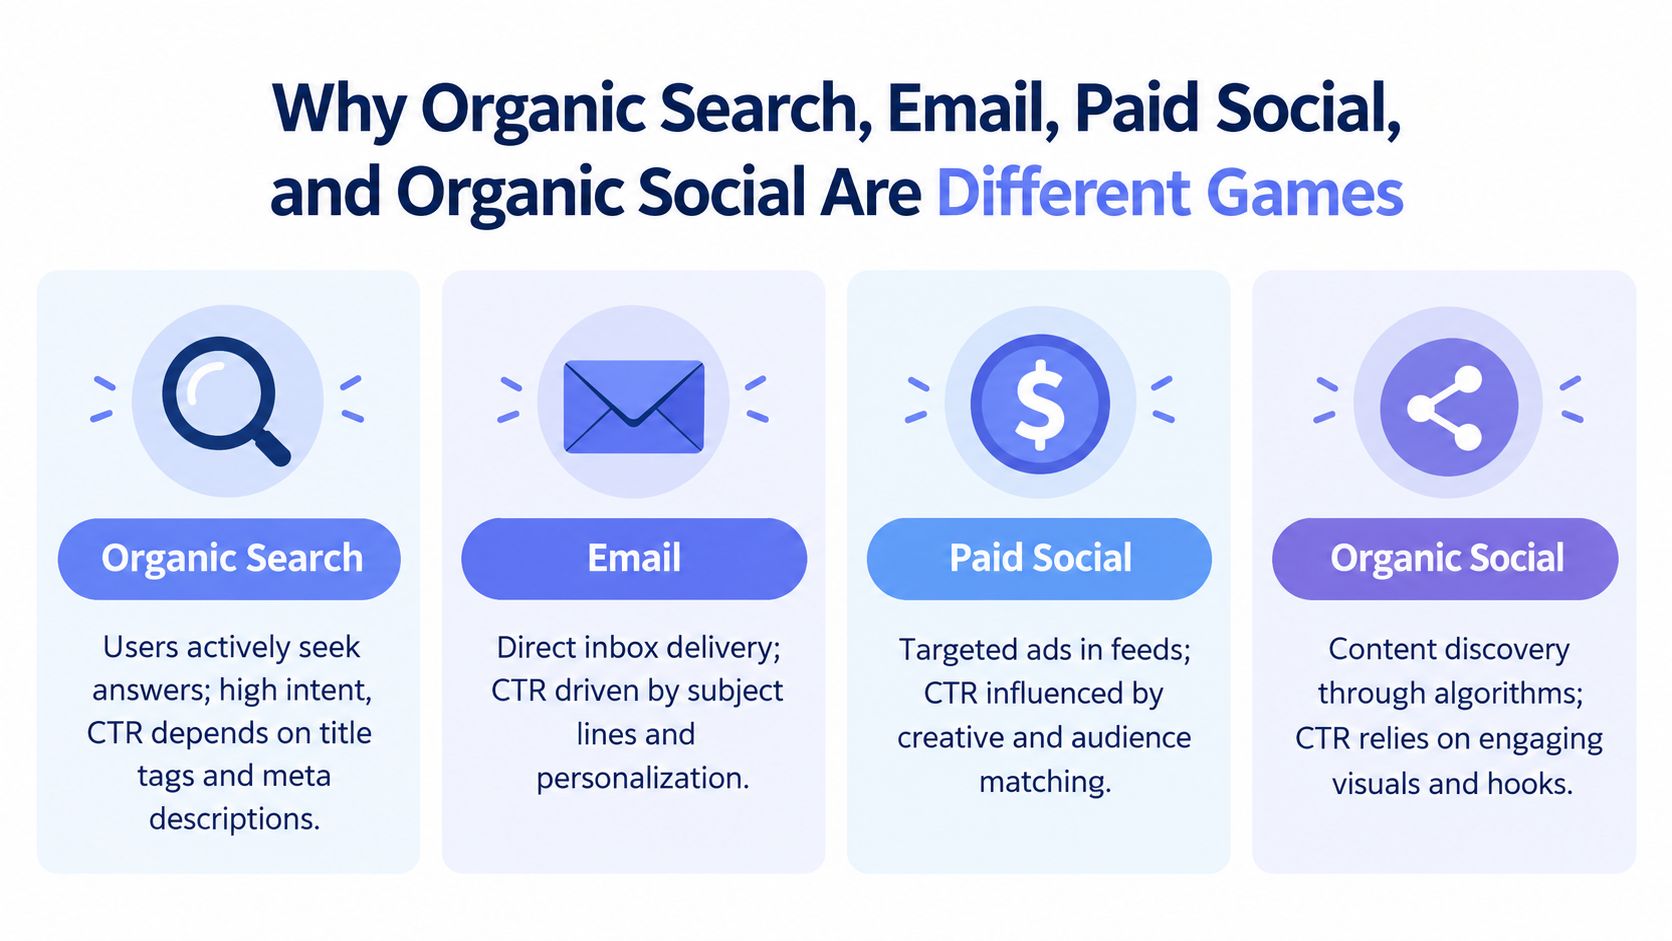 A marketing infographic comparing organic search, email, paid social, and organic social by their click-through rate strategies.
Surface | Dominant variable | Primary lever | Biggest confounder |
Organic search | Ranking position and SERP features | Title tag and meta description | Position movement |
Relevance to a known recipient | Subject line, personalization, CTA | List quality and deliverability | |
Paid social | Audience and auction fit | Creative and offer match | Fatigue and saturation |
Organic social | Platform distribution | Hook, format, thumbnail | Algorithmic reach shifts |
Search Is a Position Game First
Position can swamp copy. A multi-study comparison reports average CTRs of approximately 27% for position 1, 15.6% for position 2, and 10.4% for position 3, with estimates varying materially by dataset and context. Judge a page against its position band, query intent, brand status, device, and SERP features, not against a sitewide average.
The historical pattern is even starker. A 2014 analysis of Google Webmaster Tools data found 71.33% of searches generated an organic click on page one, while pages two and three together received 5.59%, and the first five results captured 67.60% of all clicks. Interfaces have changed since 2014, so don't use those figures as a current benchmark. Use them to remember that moving up can matter more than polishing a snippet in place.
Email, Paid, and Organic Social Fail Differently
Email gives you a known audience and stronger control over randomization, but relevance still has to be proven. Paid social adds auction pressure, creative fatigue, and saturation, so a falling CTR may mean the audience has seen the ad too often rather than that the message suddenly got worse. Separating those causes requires frequency and audience segments in the same view as clicks.
Organic social is the least stable denominator of the four because distribution is rented from each platform's ranking system. Format norms, aspect ratios, caption behavior, and link handling vary enough that the "same post" isn't really the same exposure. Even attention metrics need platform context, which is why interpreting Instagram Story insights on their own terms beats importing a search benchmark into a feed. Optimize each surface against its own history and its own failure mode.
A Testing Framework That Produces Real Evidence
Most CTR tests fail before launch. Someone changes the hook, image, CTA, and posting time, sees a lift, and declares a winner. That's not an experiment. It's a release note with a percentage attached.
The Minimum Viable Experiment
Define one primary click goal and one downstream qualified action before anything ships. Randomize comparable audiences or posting conditions where the surface allows it. Change exactly one variable, whether that's the hook, CTA, format, or send time, and log impressions and clicks for both variants from the same instrumentation.
State the hypothesis: Name the variable and the expected direction.
Freeze the controls: Keep audience eligibility, offer, destination, and timing conditions constant.
Set the stopping rule: Decide the sample and confidence threshold before results arrive.
Record context: Save position, platform, device, and any layout or distribution changes.
Judge downstream value: Compare qualified actions alongside CTR, not after you've already picked a winner.
If you're coordinating tests across several surfaces, a structured multi-channel testing framework helps keep hypotheses and learnings from fragmenting across teams. The framework matters less than the discipline. One variable, comparable groups, and a predeclared metric will beat a complex dashboard wrapped around sloppy assignment.
What the Email Evidence Actually Shows
Controlled email tests show why randomization matters. In a 2012 MarketingSherpa case study, randomly splitting the list between control and test subject lines produced a 17.36% higher average click-through rate across seven personalized campaigns. The useful lesson isn't "personalize everything." It's that the lift became actionable only when sample size and positive responses supported statistical significance.
A separate NextAfter experiment reported click rate rising from 6.3% to 8.4%, a relative lift of 32.5%, with 100% confidence reported. Report both numbers. The 2.1 percentage point absolute gain forecasts incremental clicks more usefully than the relative lift alone, and token personalization that adds a name without improving relevance shouldn't get credit for the mechanism.
A percentage lift from a tiny sample is noise wearing a lab coat. Check uncertainty before you roll anything out.
The AI Overview Confound
Search tests now carry an extra variable you don't control. An Advanced Web Ranking analysis found Google AI Overviews in 42.51% of results in Q4 2024, while combined desktop CTR for top-four results on question queries fell by 7.31 percentage points. Segment by AI Overview presence and citation status, or a layout shift will contaminate your snippet test.
Citation also needs careful handling. Seer Interactive data reported pages cited in AI Overviews had 35% higher organic CTR, but the report cautioned that the association doesn't prove citation caused the increase. Strong pages may earn both citations and clicks. Treat that as a hypothesis about visibility and trust, then test whether original evidence, tools, or a clear next step gives users a reason to click after seeing an answer.
Instrumenting Multi-Platform Experiments With One Publishing Layer
Manual cross-platform testing collapses under its own plumbing. Nine platforms mean nine auth flows, nine media pipelines, and nine chances for timestamps or post IDs to drift. If variant A goes out through one webhook and variant B through a hand-built integration, your experiment inherits every difference between those code paths.
The screenshot below shows the publishing surface I'll use as the concrete example for consolidating that work.
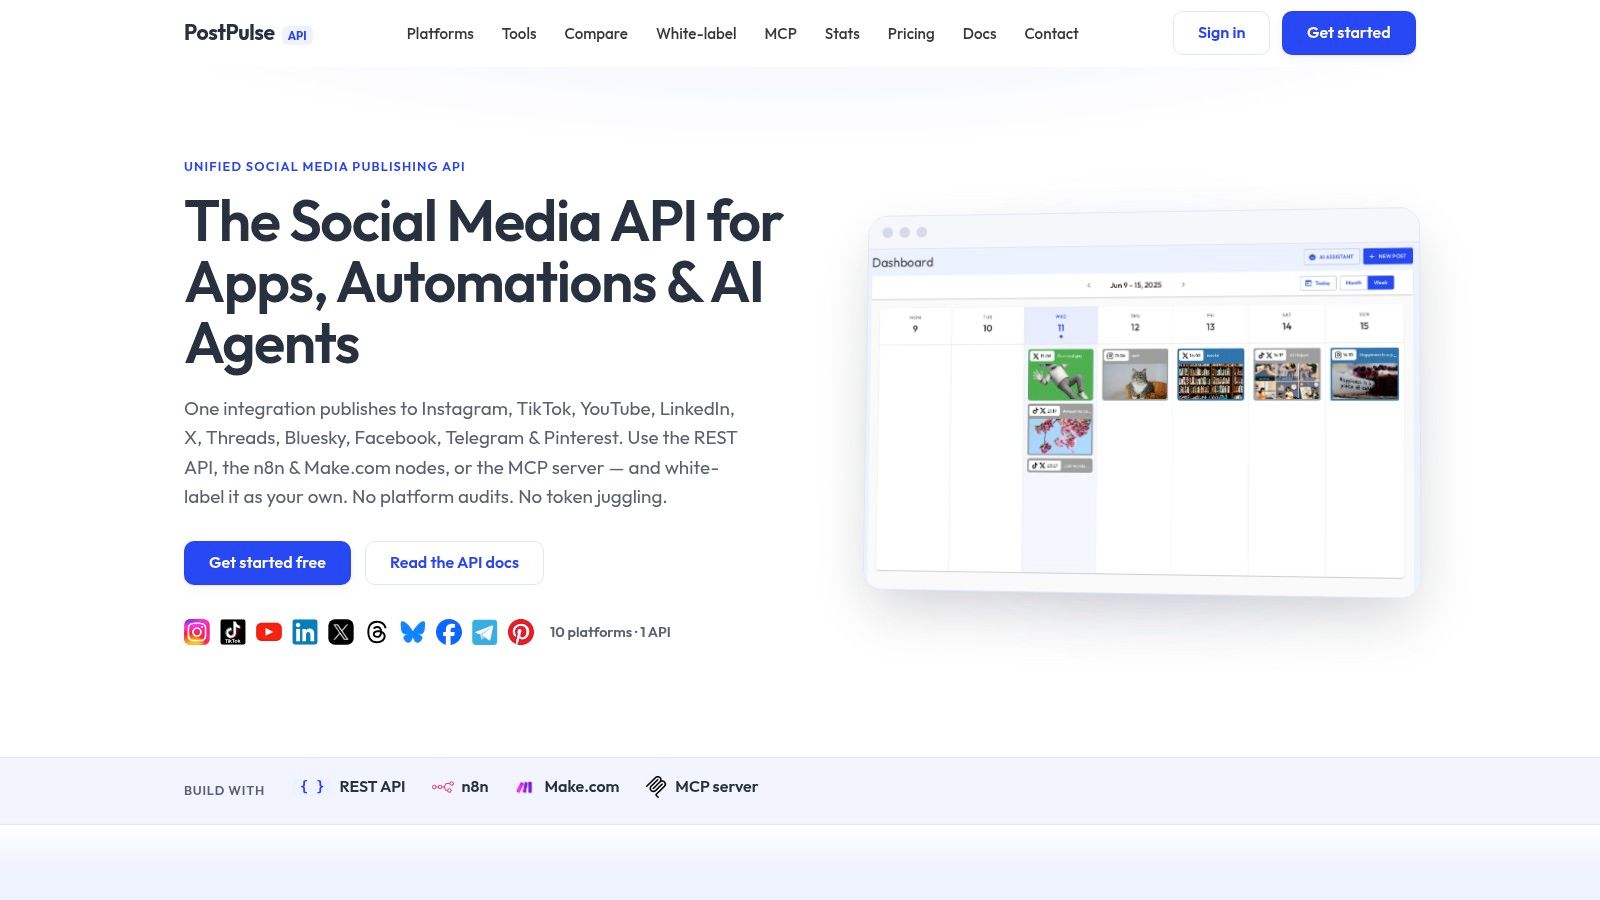 Screenshot from https://post-pulse.com
PostPulse gives you one integration for Instagram, TikTok, YouTube, LinkedIn, X, Threads, Bluesky, Facebook, and Telegram. OAuth, token refresh, rate limits, and platform app reviews are handled upstream, so your team isn't maintaining separate Meta, TikTok, and Google app approvals just to run a clean test. Consistent post IDs and publish timestamps make downstream click data joinable instead of forensic.
Pick the Integration Path That Matches Your Stack
Use the REST API when publishing lives inside your product or an internal tool. Use the official n8n and Make.com nodes when no-code builders own the workflow and need variant assignment without custom glue code. Use the MCP server when an AI agent publishes autonomously and needs the same controlled surface a human operator would get.
The demo below walks through that unified publishing flow in practice.
Pricing changes what "instrumented" means at different scales. Private-Label runs at $0.20 per publication or $5 per account per month, which suits internal tools and early experiments. White-Label runs at $200 per month plus $1 per active social account, with a startup support program that can waive fees while you're still in beta. Either way, the point isn't the tier. It's removing per-platform plumbing as a confounder so the variable you meant to test is the variable that changed.
A Practical Playbook for Shipping Better CTR Next Week
Pick one campaign you already planned to ship. Don't invent a lab project. Write the CTR definition for each surface, lock the denominator, and add one downstream qualified action such as a signup, account connection, or completed publication.
Your Next Seven Days
Day one: Audit definitions and confirm impressions, clicks, variant IDs, and timestamps are logged together.
Day two: Choose one variable, write the hypothesis, and freeze everything else.
Days three to six: Publish both variants under comparable conditions and resist mid-test edits.
Day seven: Report absolute and relative lift, uncertainty, and qualified actions side by side.
Run it across three platforms rather than nine. You'll get cleaner reads on format differences and enough operational friction to expose instrumentation gaps. If one platform produces more clicks but fewer qualified actions, believe the downstream number.
The best CTR isn't the highest CTR. It's the CTR produced by people most likely to take the intended next step.
That principle resolves the tension running through every test above. Curiosity can inflate clicks, position can manufacture them, and AI answers can remove the need for them. Your job is to build a system that tells those stories apart, then ship the next variant with evidence instead of hope.
Stop testing against nine incompatible publishing pipelines and run your next CTR experiment through one instrumented surface. PostPulse lets you publish to nine social platforms through a REST API, official n8n and Make.com nodes, or an MCP server for AI agents, with white-label options when your users should never see another brand. Ship both variants this week, measure qualified actions alongside clicks, and let clean data pick the winner.
About the Author

Founder of PostPulse — a social media scheduling platform for creators and teams. Software engineer with a passion for building developer tools and simplifying complex API integrations across social media platforms.