Setting Social Marketing Goals: A Developer's Guide
Published on June 18, 2026
Tags:
You're probably dealing with some version of the same mess.
A stakeholder asks for “social ROI by platform.” Engineering has one job queue pulling post metadata, another pulling analytics, and a spreadsheet somewhere with UTM naming rules that nobody fully trusts. One platform reports impressions at the post level, another emphasizes engagement, another gives you a metric that sounds equivalent but isn't. Then tokens expire, endpoints change, and the dashboard breaks right before the Monday review.
That's why social marketing goals matter more to developers than most marketing articles admit. If the goal is vague, the implementation becomes vague. Vague inputs produce brittle ETL jobs, inconsistent reporting, and arguments about numbers instead of decisions. The fix isn't better copy. It's treating goals like a system spec, with clear inputs, measurable outputs, and a data model that survives platform churn.
Table of Contents
The Chaos of Measuring What Matters
Monday morning, someone asks why last week's campaign “underperformed.” LinkedIn shows strong reach, Meta shows cheaper clicks, GA4 shows a traffic spike, and the CRM shows no lift in qualified pipeline. Every system is technically reporting something useful. None of them answer the same question.
That's the failure mode. Social measurement breaks when teams collect whatever each platform API returns, then try to map it to business outcomes after the fact.
A product team asks for attribution by campaign. Sales wants lead volume tied to source. Support wants first-response time on inbound social messages. Marketing asks for engagement, then mixes reactions, comments, shares, saves, and video views into one label as if those actions carry the same weight. On the implementation side, you are left stitching together metrics with different definitions, different refresh windows, different attribution rules, and rate limits that punish naive polling.
Where reporting actually breaks
The first problem is schema drift. Platform names change, metrics get deprecated, tokens expire, and one network exposes post-level clicks while another only gives account-level aggregates unless you have a higher access tier. If the goal was never defined up front, the reporting layer turns into a warehouse of unrelated fields.
That creates practical problems fast. Alerts become noisy because the system cannot tell the difference between a harmless drop in impressions and a real drop in lead-driving traffic. Stakeholders stop trusting the dashboard because the same campaign looks healthy in one tool and weak in another. Engineers keep adding joins and calculated fields to patch a modeling problem that started as a goal-definition problem.
Practical rule: If a stakeholder cannot name the decision a metric should change, leave it out of version one.
Social is hard to measure because the plumbing is messy, not because the channel is mysterious. Reach can update faster than conversions. Click data can arrive before UTM cleanup finishes. Some APIs sample, some backfill, and some revise yesterday's numbers after you already sent the report. Teams that treat social as a reporting afterthought usually end up arguing about screenshots instead of comparing a stable event chain.
This is a systems problem
Useful social reporting starts with the sequence you need to observe. Awareness might end at impressions and frequency. Demand generation usually continues through click, session, form fill, and CRM status. Support work depends on timestamps, routing, response latency, and resolution state.
Once that sequence is clear, implementation choices get clearer too. You can define canonical identifiers, decide where UTMs are generated, store raw platform payloads before normalization, and set refresh intervals that respect both business needs and API quotas. That is also why tracking campaign KPIs and UTMs belongs in the engineering design, not in a cleanup sheet someone maintains on Friday afternoon.
A workable reporting stack needs a contract. Which platform object maps to which business event. Which metric is authoritative when two tools disagree. How token refresh, retry logic, and late-arriving data are handled so weekly reporting does not break every time an API changes shape.
If the current setup still feels improvised, it helps to review proven social media reporting workflows before adding more queries, more charts, and more confusion.
Translating Business Needs into SMART Goals
SMART goals get dismissed because the acronym sounds like generic marketing training. Used properly, it's closer to an interface definition.
A good social goal should be machine-readable. You should be able to point at it and immediately know the time window, the success metric, the owner, and the data source. If you can't, the request is still just a wish.
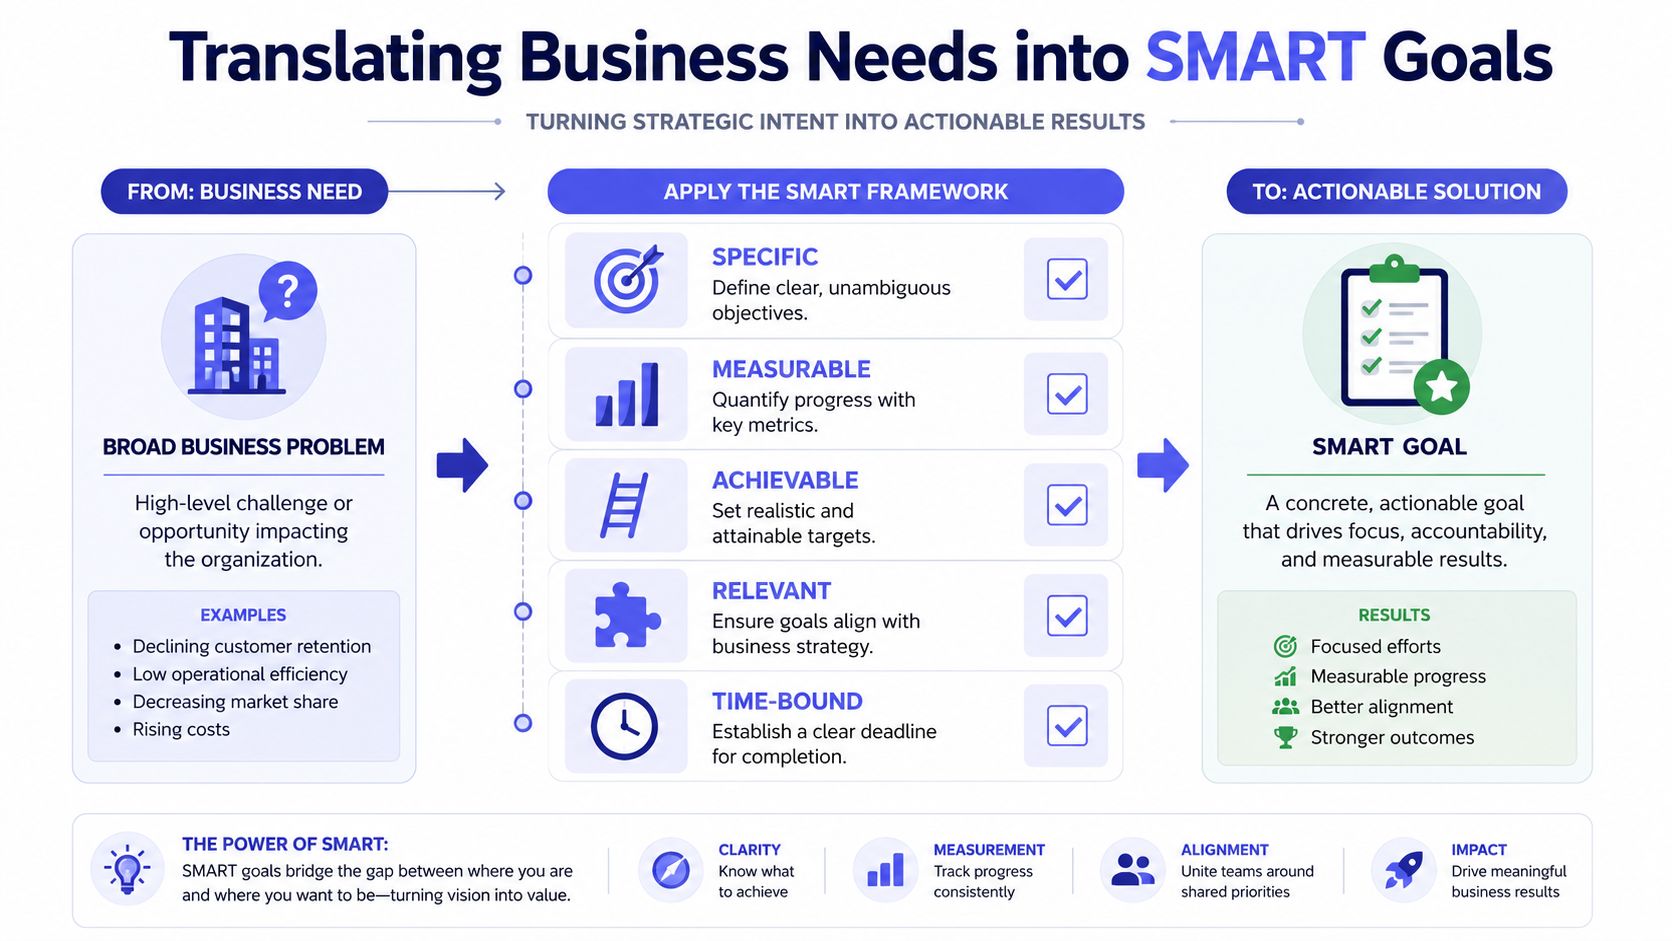 A diagram illustrating how to translate broad business problems into concrete and actionable SMART goals.
Treat SMART like a schema
Sprout Social recommends converting broad objectives into SMART targets and limiting each campaign to 1 to 3 core KPIs so the metric chain stays tied to business results. That advice maps cleanly to implementation work.
Here's what each letter should mean in practice:
Specific means you define the platform, content type, audience action, and owner. “Grow presence” is unusable. “Increase LinkedIn click-throughs on product launch posts” is implementable.
Measurable means you've named the exact KPI and where it comes from. Not “engagement.” Something like engagement rate, click-through rate, conversions, or social-attributed revenue.
Achievable means the target matches operational reality. If your ingestion runs daily, don't promise hourly alerting. If your historical baseline is noisy, don't claim precision you can't support.
Relevant means the metric aligns with the business objective. Likes don't validate a lead-gen campaign.
Time-bound means the query window is explicit. Seven days after publish is different from calendar month reporting.
A vague request versus a usable one
Bad input:
“We need better traction on Instagram.”
Usable input:
“For the next launch cycle, track website traffic from Instagram campaign links and compare post cohorts over a defined reporting window.”
That difference changes everything. It tells you what to store, what to aggregate, and what to ignore.
A SMART goal isn't motivational language. It's the minimum metadata required to build reliable analytics.
Keep the KPI set small
Teams get into trouble when they try to track everything the API returns. More fields don't create more clarity. They create more disagreement.
A tighter pattern works better:
Pick one primary outcome tied to the campaign's job.
Add one validating metric that explains whether the primary result is healthy or fragile.
Add one operational metric if execution quality affects the outcome.
For example, an awareness campaign might use reach as the primary KPI, engagement rate as the validator, and publishing consistency as the operational check. A lead-gen campaign might use conversions as primary, CTR as validator, and landing page tag integrity as the operational check.
That structure gives developers room to push back. When someone asks for “all available metrics,” the right answer is usually no. You don't need all metrics. You need the smallest set that supports a decision.
Mapping Goals to the Marketing Funnel
Monday morning, a stakeholder asks why social drove "strong engagement" but sales stayed flat. The answer usually sits in the funnel map. The team measured response in the middle, while the business expected action at the bottom.
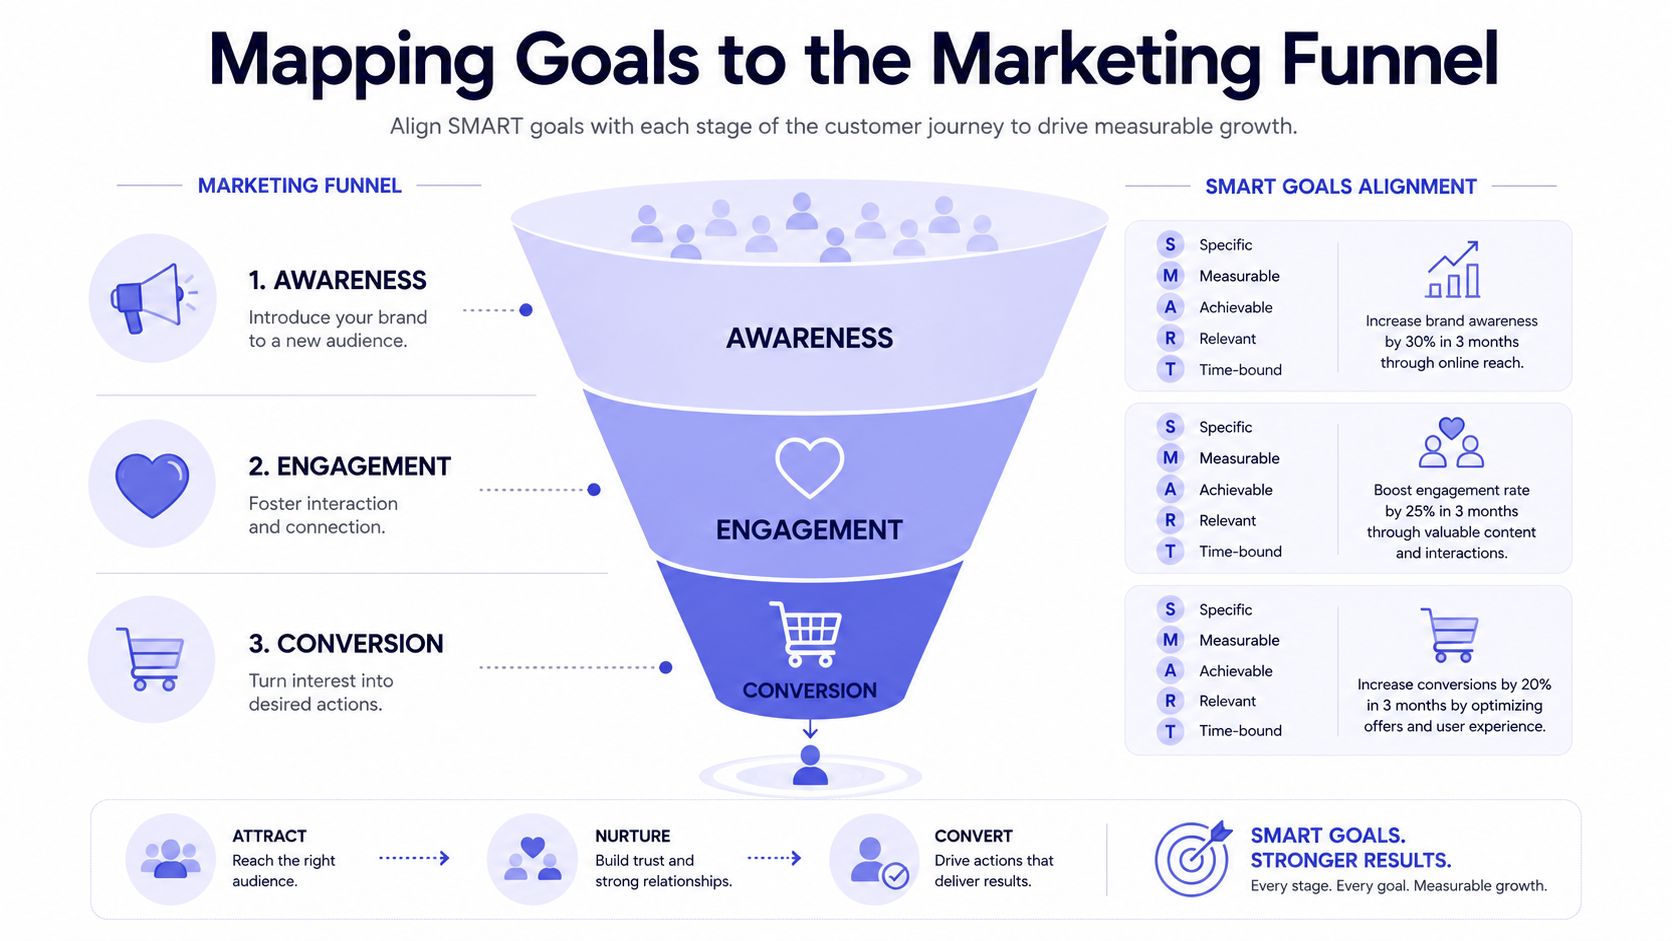 A diagram mapping SMART goals to the marketing funnel stages of awareness, engagement, and conversion.
The funnel gives you a practical state model for instrumentation. A user can see a post, react to it, click through, and complete something useful in another system. Each step produces different events, comes from different APIs, and breaks in different ways. Treating all of it as "social performance" is how reporting turns into a pile of mismatched counters.
Awareness is delivery
At the top of the funnel, the question is simple. Did the platform deliver the post to enough of the right people to make the campaign possible?
Reach and impressions sit here, but they are not interchangeable across networks. Some APIs expose both. Some expose one. Some rename or redefine them. If your warehouse stores them without a platform-specific definition table, analysts will compare values that were never measuring the same thing. For teams that need a cleaner distinction, this guide to Instagram impressions and what they actually measure is a useful reference.
The classic AIDA marketing definition still helps here because it separates attention from later intent. That separation matters in reporting. If the campaign brief says "get the launch in front of the market," delivery metrics belong at the top of the dashboard. If the brief says "generate qualified demos," delivery metrics stay in a supporting role.
Engagement is response
The middle of the funnel captures signs that a user noticed the post and did something with it. Comments, shares, saves, profile visits, and link clicks all count as responses, but they carry different weight.
That is where a lot of teams get sloppy. Platforms group these interactions under one engagement label, then dashboards repeat the grouping as if every action means the same thing. It does not. A share often signals stronger interest than a like. A click is usually more useful than either if the campaign depends on downstream traffic. Saves can matter for education content but mean very little for a short-lived promo.
A better implementation is to map each raw metric to a funnel_stage field and an action_type field in your reporting model. Then you can aggregate engagement without losing the underlying behavior. It also makes QA easier when one API version deprecates a metric or starts returning partial data after a permissions change.
If a team optimizes for a middle-funnel metric, the report should say it is a proxy and name the business outcome it is standing in for.
Later in the same model, a useful teaching aid can help non-technical teammates see the progression visually.
Conversion is the handoff to business systems
Bottom-funnel reporting stops being a social API problem and becomes an identity and attribution problem. The conversion usually happens on a site, in a product, in a checkout flow, or inside a CRM. Social platforms can hint at that outcome, but they rarely give you a clean source of truth.
That means the handoff has to be designed. UTM discipline matters. So do click IDs, event naming, consent handling, token refresh jobs, and rules for late-arriving conversions. If the paid team uses one campaign naming pattern and the lifecycle team uses another, joins fail. If link shorteners strip parameters, you lose the path. If a platform rate-limits yesterday's backfill, your conversion report changes after the exec deck went out.
Good funnel mapping makes those failure points visible early. Awareness depends on delivery data. Engagement depends on response data. Conversion depends on getting social identifiers into business systems and back out in a form you can query consistently. That is the difference between a funnel slide and a working measurement system.
Choosing KPIs That Drive Action Not Applause
A lot of social dashboards are applause dashboards. They show signs of attention, but not signs of progress.
That distinction matters. Research on behavior-change marketing argues that success should be judged by behavioral outcomes, not exposure alone. The NIH review makes that gap clear in social strategy: awareness and audience reaction matter, but effectiveness is ultimately about whether people took the desired action, not whether they merely saw the message (NIH review on behavior-focused social marketing).
Vanity metrics are seductive because they're easy
Follower count is easy to explain. So are likes. They're also dangerous because they detach reporting from intent.
A like can mean appreciation, habit, agreement, or nothing much at all. It rarely tells you whether someone moved closer to purchase, signup, adoption, or retention. That's why your KPI set should favor actions with clearer behavioral meaning.
Good KPI selection usually follows this rule set:
Prefer intent over visibility when the goal is downstream action.
Prefer ratios over raw totals when audience size varies across accounts or periods.
Prefer metrics linked to user movement such as clicks or conversions over passive reactions.
Prefer KPIs you can join to web, CRM, or product events if the campaign has business outcomes attached.
A related discipline from goal-setting frameworks can help here. Teams using marketing OKRs to drive outcomes often avoid metric sprawl by forcing each KPI to support a specific objective rather than just filling space in a report.
Funnel-based KPIs by platform
You don't need a giant universal score. You need a short list of metrics that make sense by stage and by platform behavior.
Funnel Stage | Platform | Recommended KPI | Why it Matters |
Awareness | Reach | Better fit than raw follower count when the job is distribution | |
Awareness | TikTok | Views or reach | Useful for checking whether content got initial exposure |
Awareness | Impressions | Strong top-funnel indicator for distribution-oriented posts | |
Awareness | X | Impressions | Helps compare visibility across post types |
Awareness | YouTube Shorts | Views | Basic signal that the content entered the feed and was watched at least initially |
Engagement | Link clicks or saves | Closer to intent than likes alone | |
Engagement | TikTok | Shares or profile visits | Better signal that content prompted further interest |
Engagement | Click-through rate | Useful when posts are meant to move users to a page | |
Engagement | X | Link clicks | More actionable than favorites for traffic-oriented campaigns |
Engagement | YouTube Shorts | Clicks to destination or deeper channel action | Indicates movement beyond passive consumption |
Conversion | Conversions from tagged campaign traffic | Connects post activity to business outcome | |
Conversion | TikTok | Leads or purchases from tracked links | Ties content to outcome instead of feed reaction |
Conversion | Lead form completions or attributed pipeline | Strong fit for B2B social | |
Conversion | X | Signups from campaign URLs | Keeps the metric grounded in action |
Conversion | YouTube Shorts | Site conversions from tagged links | Measures whether video traffic turns into a result |
Choose the metric your system can defend
Developers should be a little skeptical of any KPI that sounds impressive but can't survive an audit. If someone asks why a metric changed, you need a clean answer about what event produced it and how it's counted.
That's another reason to avoid vanity-heavy reporting. It's hard enough to explain platform-specific definitions as it is. Adding low-signal metrics just creates more room for confusion. If you need an example of how easy it is for teams to overfocus on surface visibility, this breakdown of what impressions mean on Instagram is a useful reminder that exposure metrics answer a narrow question, not a full business one.
Metrics should help someone decide what to do next. If they only help someone feel good, they belong lower on the dashboard.
Building a Unified Goal Tracking System
Monday morning, the dashboard says Instagram engagement is up, LinkedIn leads are flat, and X data stopped updating sometime overnight. Marketing wants answers before standup. Engineering wants to know whether the sync failed, the token expired, or the platform changed a field definition again.
That is the actual job. A unified goal tracking system is less about charts and more about building a pipeline that can survive inconsistent APIs, delayed metrics, and business users who expect one number to mean the same thing everywhere.
Start with a canonical schema
Keep these concepts separate from day one:
Content identity such as platform, account, post ID, content type, and publish timestamp
Goal identity such as campaign ID, funnel stage, primary KPI, reporting window, and owner
Metric facts such as metric name, value, observation time, and source platform
Attribution keys such as campaign tags or other IDs that connect social activity to downstream systems
Operational facts such as fetch status, auth status, rate-limit state, and last successful sync
This separation saves you later. Posts get edited, campaign ownership changes, attribution rules get revised, and platform metrics are occasionally renamed or deprecated. If all of that lives in one denormalized record, every change turns into a migration problem.
Normalize meaning, not just field names
Renaming likes to engagement_count is not normalization. It only hides platform differences behind cleaner labels.
The useful version of normalization decides what an event means in your system and stores enough detail to defend that decision. A comment, share, save, profile click, and link click should not collapse into one mystery score unless your team has agreed on the formula and versioned it. I usually prefer storing atomic actions first, then computing rollups in reporting tables. It costs more storage, but it makes audits, backfills, and logic changes much easier.
Operational metrics belong in the same system. Response times, sync failures, token expiry, and missing fetch windows all affect what the business sees in the dashboard. If customer support happens inside social channels, delayed replies are part of performance, not a side issue.
Build note: A dashboard can render perfectly while the underlying system is already lying. Track data freshness, auth health, and job success alongside campaign metrics.
Build the pipeline like an integration, not a report
A workable loop usually looks like this:
Fetch on a schedule with explicit handling for late-arriving metrics and platform-specific reporting delays.
Store raw payloads before transformation so you can trace bad numbers back to the source response.
Map into canonical events and metrics with versioned transformation rules.
Aggregate by campaign, channel, and funnel stage in tables built for reporting, not for ingestion.
Emit system events for failures such as rate-limit throttling, stale tokens, schema drift, and broken joins.
The trade-off is straightforward. A thin pipeline is faster to launch. A traceable pipeline is slower to build but far easier to operate once stakeholders start questioning numbers.
If you are working directly with platform APIs, read the docs with an integration mindset. Authentication scope, insight availability, pagination, and refresh behavior all shape what your reporting system can promise. Even a focused guide to the Instagram Graph API authentication and insights model is enough to show how much maintenance sits behind one platform connection.
The teams that get this right stop treating social data as screenshots from vendor dashboards. They treat it like any other production data source. Define the schema, log the failures, version the transformations, and make every KPI traceable to an event you can fetch.
From Poster to Architect The New Mindset
Social is often still discussed like it's a content problem. For developers, it's a specification problem.
The shift is subtle but important. Stop starting with “What should we post?” Start with “What outcome are we trying to produce, and what event chain would prove it happened?” That question leads to better schemas, better reports, and fewer arguments in review meetings.
The useful version of social marketing goals isn't motivational. It's operational. A goal should tell you what to instrument, what to query, what to join, and what to leave out. SMART framing gives you the contract. Funnel mapping gives you the state model. KPI discipline keeps the dashboard honest. A unified tracking system turns all of that into software.
When teams make that shift, social stops feeling like a black box. It becomes another measurable system with known inputs, defined outputs, and failure modes you can debug.
If you want the shortest path to that setup, PostPulse gives developers one integration for publishing across multiple social platforms through a REST API, official n8n and Make.com nodes, or an MCP server for AI agents. It's useful when you'd rather spend time on your product, automations, and reporting logic than on OAuth churn, platform app reviews, token refresh plumbing, and maintaining separate integrations for every network.
About the Author
Founder of PostPulse — a social media scheduling platform for creators and teams. Software engineer with a passion for building developer tools and simplifying complex API integrations across social media platforms.